My 8 step options trading “mindset, methodology & math”
I want to make sure that I have a trading system in place before putting my capital to work.
Talk to any successful trader and you will find that they have a detailed trading system in place that they follow in their every trade in every asset class (options trading is no different). My trading system (in beta test) is called ‘master trading plan‘, outlines when and how to ‘enter’ and ‘exit’ before I ever put my hard-earned capital on the line. The ‘master trading plan‘ system helps me to outline entry, target, and stop points on the charts, that I trade later. In the near future, I am thinking of automating my trading system with machine learning for trading (ML4T), to trade in real time.
Professional Trading Combines Traditional Left-Brain Skills of Theory, Logic, Math & Analytical Thinking with the Intuitive, Inductive Skills of Right Brain Thinking to Find the Sweet Spot with the Greeks.
Mindset: 8 Steps to Think Like A CEO,
Methodology: 8 Steps to Construct a Trade
 Why trade? Not false hopes, but genuine, viable alternatives to the traditional “opportunities” out there.
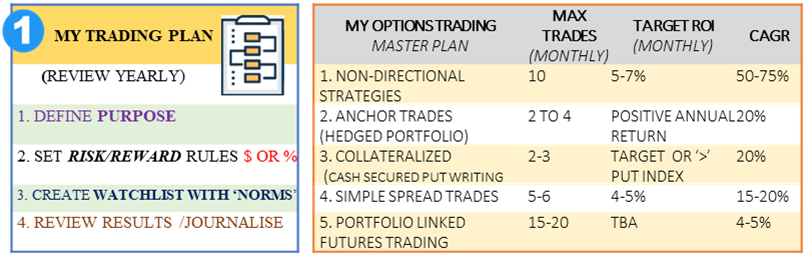
Mission: A good mission statement is quick, short, and sticks in people’s brains. What purpose are you working toward every day?
Set rules, take snap decisions, understand fear and avoid greed, create well defined processes and conduct research.
My mission: what I want to do with my life, trading is just one aspect of my life’s sub-goals.
Vision: My vision statement expresses the long-term aspiration to trade Options for income generation and hedging with my ‘day trading’ and ‘wealth accounts’. What change do they want to make in my life (or the world)?
My vision is to be a Professional Options Trader, who combines traditional left-brain skills of theory, logic, math & analytical thinking with the intuitive, inductive skills of right brain thinking to find the sweet spot with the Greek.
Vision- How I see myself in the future with my mind’s eyes
Values: It’s great to have a set of qualities that define the way I want to trade.
My Personal Top 3 Goals (higher level goals & longer time)
- Where do you want to be in 30 days?
- Where do you want to be in 12 months?
- Where do you want to be with your bank account, Bills & Mortgage?
Trading Goals (Short Term, for each & every trade’) By the standards of the rest of the world, we over trust. We’re okay with that. Before any trade, I set my goal(s) this trade options to:
🦾 Get cheap/easy leverage? Most spread trades, fast short-term trades
⏲️ Bet on a specific event? (New product release, earnings, or specific events)
⚖️ Bet on asymmetrical risk? (When TA and core strategy confirms trend, then I can go with the trend and I can express risk asymmetry)
🪙 Earn yield? (Dividend effect)
📈 Go long volatility?
🦔 Hedge my position?
🎲 Trade as gamble? Yolo on lotto ticket? (don’t do it!)
 All things related to product – processes, best practices, setup guides, and more!
FIND YOU EDGE: I need an Edge & ‘law of large number’, in the long run to be profitable.
Expectancy = (Probability of Win * Average Win) – (Probability of Loss * Average Loss)
Market inefficiency: options market always prices an even chance of moving up vs. moving down, regardless of what happened before. Get bearish/bullish/neutral on ULA/stock based on that historical movement, we have a high probability of winning the trade, but the options market can’t price that in. Trading option market prediction (50/50) against the historical data that suggest different outcome (greater than 50/50) were (past HV) vs. are (current IV), historical movement vs. implied movement.
- (Past HV data-Were) Look at the historical movement data and see what our probabilities were
- (Present Implied IV data-Are) Compare them to what the options market’s probabilities are: Risk/Spread Width = Probability %
The essence of the casino strategy:
- Take on lots of small bets.
- Take only bets that provide a probabilistic edge to the casino (their edge ranges from less than 1% to as much as is always positive).
- Manage risks on entry (the casino does this by limiting the size of any customer bet).
My Edge: Before settling on market, products or index like to trade (GOOG, AAPL, VIX, etc.), learn WHAT you’re trading. What do I prefer to trade? Things (logical) you can trade:
- DIRECTIONAL
- Price Direction (up or down) Delta: E.g., selling CSPs trading structure with positive deltas, limit to stocks take long positions only. Delta trading can be hard – as core strategy, technical and fundamental analyses must be consistent especially in the short term.
- “Theta” positions, but many without delta
- NON-DIRECTIONAL: Relative value strategies in the volatility space. Create value buying cheap exposures and selling expensive exposures at the same time, trying to hedge out the main directional market risks that would dominate a traditional asset allocation. Identifying trades is really an important part of the process as they move around all the time over different cycle frequencies.
- cash-secured put selling are types of opportunities that might last for several years while those strategies are popular
- Volatility (IV vs. HV): Long term basis is IV vs HV. Volatility trading involves making a bet that predicted volatility IV (the amount of movement the market thinks will occur) will differ from realized volatility (what actually happens post prediction).
As efficient as the market is, it almost never gets it right, with the exception of major, major products.
We can bet that the product will overshoot its implied volatility (long vol) - IV trading: We can bet that the product will undershoot its implied volatility (short volatility)
- Gamma Scalping (time decay): Gamma scalping is long volatility position. It is (buying a straddle with theta) and delta hedging it -Straddles are long gamma; their delta changes favorably: up move – +positive deltas; down move negative deltas. This process forces you put assigned (to go long/buy ULA) when it drops and call assigned (go short/sell) UL when it rallies. Theta here is annoyingly eating your gains. Gamma scalping is great when RV >IV. In this case, gains from gamma will be greater than the theta we have to pay. If IV > future RV, gamma scalping loses money, so sell theta.
- Reverse Gamma Scalping is a short volatility position- Collecting Theta. SPY moves less than implied volatility, which means gamma scalpers lose money overall. Instead of buying a straddle and delta hedging it, sell the straddle. (Risk= buy stock (short put assign when prices are high put call assign) and sell (short call assign short) when it’s low. As the stock rises, we get negative deltas (and have to buy stock to hedge), and when the stock falls, we have positive delta, which we hedge by selling the stock at lower prices. The good thing is that we can collect lots of Theta.
- Correlation/Relative Strength/Beta (Pairs Trading)
- Mispricing/Difference in pricing (Pure arbitrage)
- Order Flow (HFT)
- M&A/Special Situations (Merger Arb)
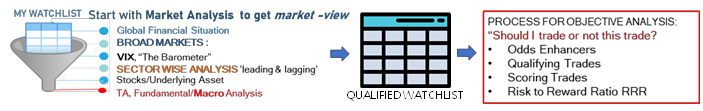
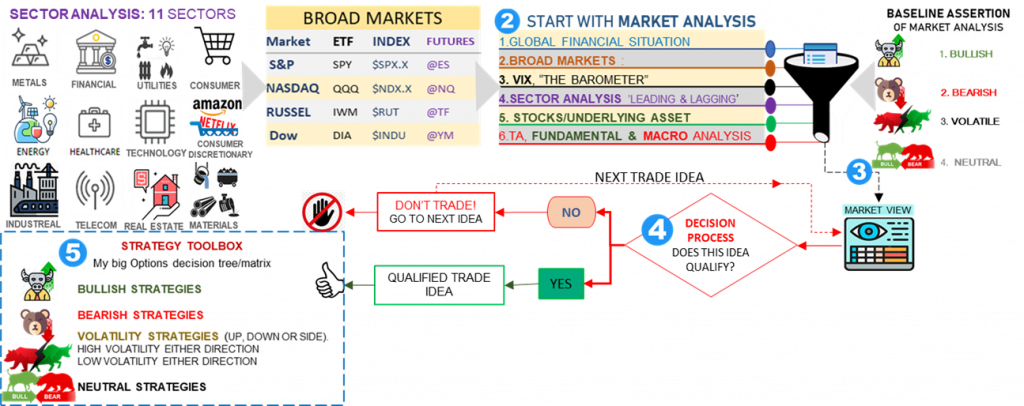
Creating a Watch List:
The key to profitable trading is to have a view of the market & its environment and then express that view to the best of your ability. If your view is correct and you express it well, you will make money. Having either an incorrect opinion or expressing your opinion incorrectly will result in losses. For that reason, with any structure, it’s a good idea to start off by understanding how our P/L will move in different scenarios. My View on the markets:
- Understand market structure
- Understand narrative
- Understand technical, sentiments and positioning

- Liquid Options – I want to trade the products with the most actively traded options. This way I can get in and out quickly at good prices.
- Volatility – I’m looking for products that show a history of good movement back and forth. Ideally, I’m looking for quick moves so I can get in and out as soon as possible.
- Diversification – I keep a broad list of underlines covering a number of different sectors (tech, energy, financial, index are the big ones for me).
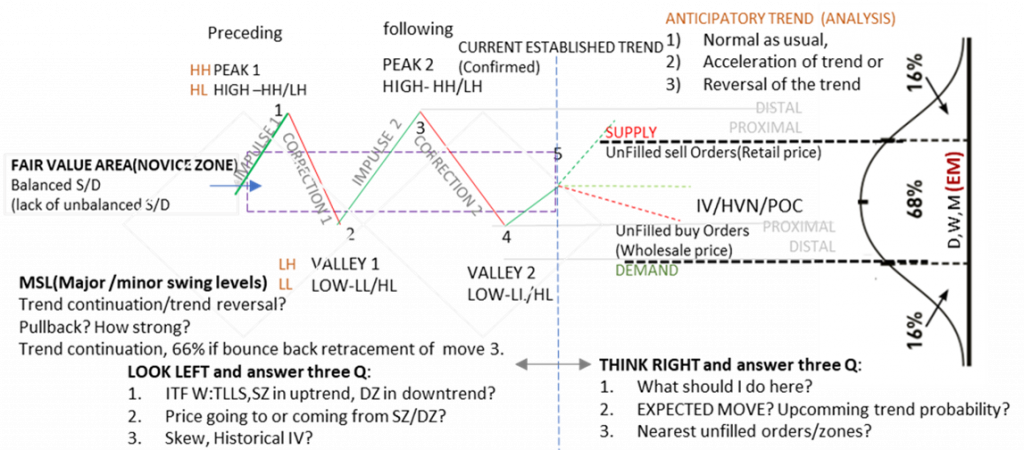
FORMULATING MY ASSUMPTIONS
| 1 DIRECTION: between current time to expiration | 1. WHAT (IF ANY) DIRECTION: Up, down, or sideways? 2. Is price Likely to Move toward or away from key levels? | RANGE DAY: 60-70% DAYS N=20 ARE RANGE DAYS TREND DAY: 20-30% DAYS ARE TREND DAYS HYBRID OR TREND TO RANGE |
| 2 EXPECTED MOVES | FIND KEY LEVELS *see trade setup •Major Trendlines •Round Numbers •Major Moving Average | Rough amount of price change during 30-60 days. D, W, M Price change would be volatile or narrow range? |
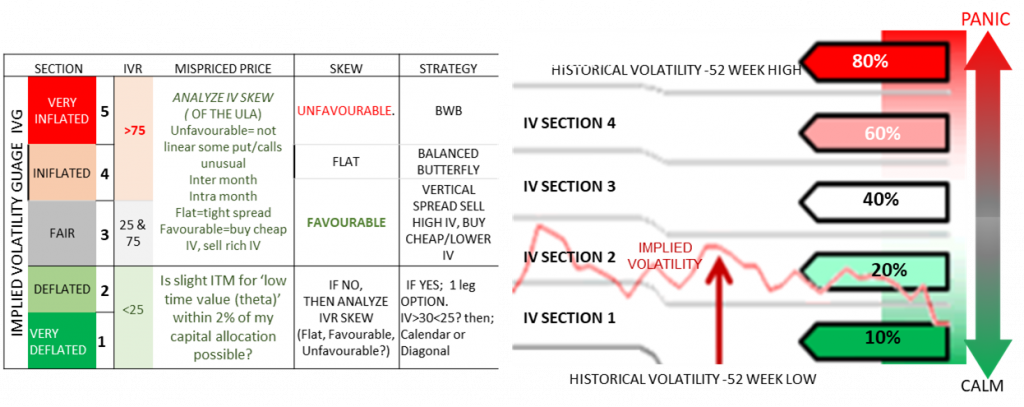
| 3. IMPLIED VOLATILITY VIX high means traders are hedging. | VOLATILITY CONDITIONS: What is current volatility? Current ATR Value: Current ADX Value: >30 high, <15 low Current VIX Value: Cyclical? (hi +->10), VIX >100? Trade more when IVR > 55% | What is FUTURE Volatility? 1. Increase 2. decrease 3. about same |
| INFORMATION TO FORM ASSUMPTION | 1. What is the trend? 2. Are stock prices at the high end or low end of their range? 3. Are stock prices trading within a narrow range? 4. Are stock prices at key support or resistance levels? 5. Does the volume show heightened trading activity? 6. Do price changes demonstrate extreme momentum? 7. Are there any key upcoming corporate events during the next few expiration periods? | This my view on markets, formyulated in the shape of assumptions |

Targets: Accept or reject trade candidates from watchlist with Scorecard to ‘odds enhancement process’.
Objective: Find potential trade candidates
- Find Targets: by taking action: “choose an asset universe.” Choose an underlying (ULA) -> action: filter asset universe.

- Market cycle: Determine the stage of business/market/underline
- Market trend: Determine the Intermediate US (broad markets)
- How do to identify mispriced options? Every time the price of the option rises above or falls below the fair value, they consider it mispriced. (about) 6 common factors that are responsible in the formation of an option price.
- Advantages Of Using Option Mispricing: T1 to Tn (T1 is the time of entry and Tn is the time when the underlying instrument achieves the target). For example, the volatility skew often provides insight as to bullish or bearish sentiment Options markets during black swan events tend to be extremely mispriced
Odds Enhancer: Guides & Processes
Trade Selection Process: 8 Steps Top-Down process over ‘price action’ & ‘technical’ approach which is interpreted within fundamental analysis:
- Determine the stage of business / market cycle
- Determine the Intermediate US market trend
- Check for any undesirable macro / market events within expected trading period
- Check for stocks displaying strong technical entry signals conforming to all the above
- Check for undesirable events on the above stocks within expected trading period
- Check for options that fits our options Greeks’ criteria for trading within the expected trading period
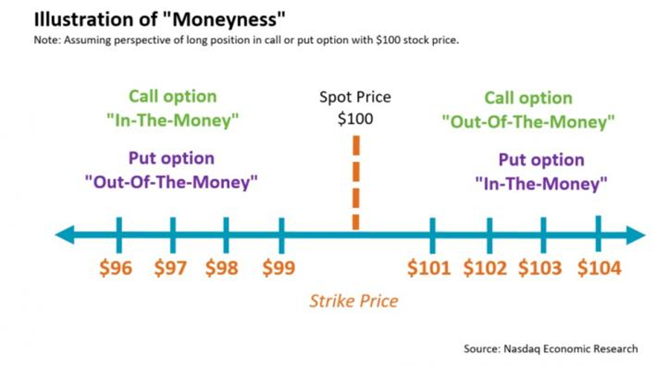
- Directional Assumption: can either be bullish (you think the price will go up), bearish (you think the price will go down) or neutral.
- Delta: directional risk, near 0 (range-bound), positive Delta profits from a move up in the underlying’s price (bullish), a negative Delta means the opposite (bearish)and a Delta near 0 means that neither a move up or down will impact the P&L (neutral) that strategy significantly.
- Vega: Vega is the option Greek that measures price changes for changes in implied volatility. A negative Vega means that the option strategy will profit from decreasing IV and a positive Vega means that the option strategy will profit from increasing IV. A negative Vega (high volatility)
- Risk: A defined Risk/ undefined
- Reward: Compute the Payoff for Call and Put Options:
- Example: set up the long butterfly strategy, now let’s compute the payoff for call and put options. Remember, that the payoff of a long call option is given by:
- Long Call Payoff=𝑀𝑎𝑥 (Spot Price−Strike Price,0) −Premium
- The Max function is interpreted as the following:
- If the spot price is higher than the strike price, then the long call payoff is the difference between the spot and the strike price.
- If the spot price is lower than the strike price, then the long call payoff is 0.
- Can you guess how to compute the short call? It’s simple, you just need to multiply the above functions by -1 to have the short-sell version of the call option payoff. Do you know how to compute the payoffs of the options in Python? We’re going to help you out. Let’s define separate functions to compute the call and the put payoffs.
- Long Put option payoff: For a long-put option payoff, we have the following formula and its interpretation:
- Long Put Payoff=𝑀𝑎𝑥 (Strike Price−Spot Price,0) −Premium
- If the strike price is higher than the spot price, then the long-put payoff is the difference between the strike and the spot price.
- If the strike price is lower than the spot price, then the long-put payoff is 0.
- Theta: short option strategies profit from time passing by (positive Theta) and long option strategies usually lose some of their value due to time passing by (negative Vega). Once again, some strategies profit/lose more from time decay than others. For example, a naked short option profits more from time decay than a credit spread. Want for your strategy is a positive Theta? A positive Theta would mean that the strategy profits from time decay.
- Number of Legs:
- IV: ULA with high implied volatility (IV). To profit from a drop in IV, you should find a strategy with a negative Vega. have limited buying power available? I would prefer a defined risk strategy over an undefined risk strategy.
- Credit or debit to open: Option strategies that require a debit to be opened are profitable if they can be sold for more than they were bought for. Option strategies that take in a credit when opening, on the other hand, are profitable if they can be bought back for less than they initially were sold for
- Check for short term market sentiment using our proprietary process to determine entry point
- Perform Scorecard Metrics /entry Checklist process ‘odds enhancer’ which will filter out weak performing underlines/stocks. This step will lead me to evaluate a potential strategy (final decision) of selected underlines:
Scorecard Metrics /entry Checklist process [a.k.a. ‘odds enhancer’]
- Maximum profit: Max Gain MG: some specific amount at entry other (e.g., calendar/long call) undefined MG
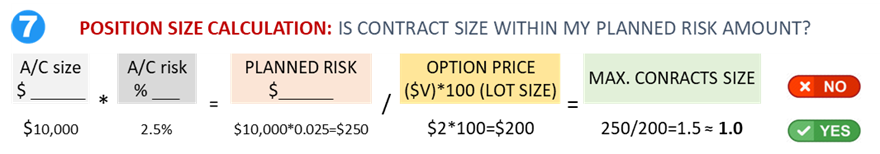
- Maximum loss (risk): Max Loss ML: If undefined ML can be computer form 2xSD +-S0
- Buying power reduction (BPR)
- Breakeven (B/E) values
- Probability of profit (POP): select POP 55 to 80%, sometime 50% POP can be entered if other factors are favorable, do not trade below 50% POP
- Theta and delta efficiency:
- Receive min of 0.1% of portfolio size theta decay/daily. (For $100,00 portfolio 100,0000.001=$100/day) Theta efficiency=100(theta of the position)/BPR; e.g., Put spread –P +P theta (-0.01985-0.1585=$6; efficiency =1006/2085=0.288% (get min 0.25% efficiency).
- Delta efficiency=delta of position/BPR: delta is approx. Equal to the number of shares of ULA, delta efficiency should be minimum number. Risk profile: graphical display Return on capital (ROC) and ROC/day ROC=100(max profit/BPR) seek ROC/day >0.25%
- ROC/day=100(max profit/BPR)/DTE
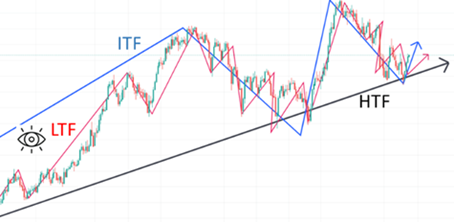
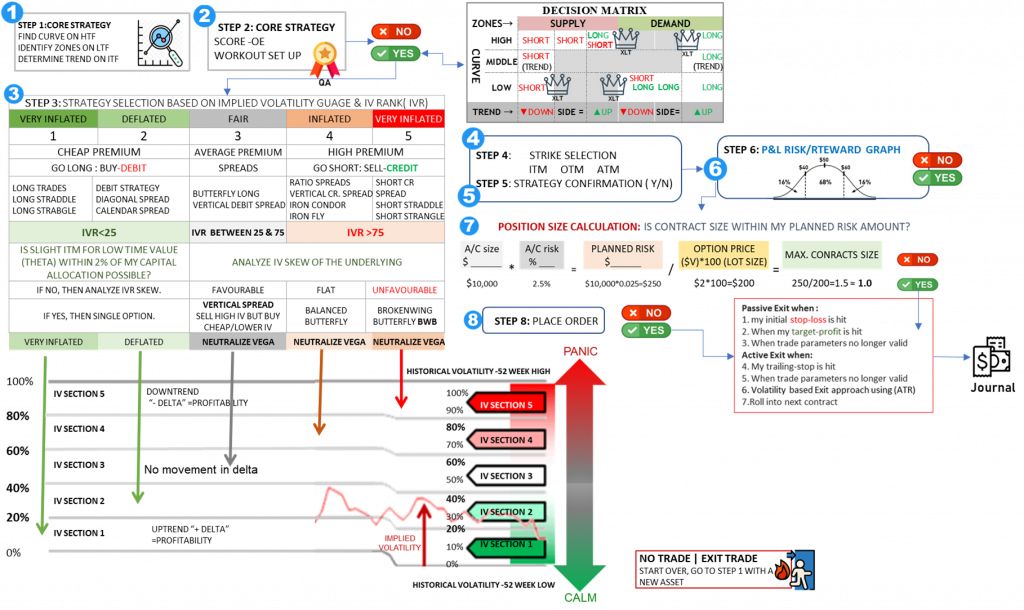
REACTIVE ANALYSIS: ‘TLS CORE STRATEGY’ WORKFLOW
(T) TREND: FIND ESTABLISHED SWING ON ANCHOR CHART (ITF -W):
(L) LEVELS: CHECK MAJOR LEVELS OF STRUCTURES
(S) SIGNAL: LTF-D ETF: DETERMINE A VALID TRADE SET UP
TRENDLINE BREACH? Descending patterns break up, and ascending patterns break to the downside. *U-TURN near trend line?
POLARITY CHANGE? an Uptrend will eventually break polarity by printing some combination of a LH/LL, and a Downtrend will eventually break polarity by printing some combination of a HL/HH.
LEVELS: Mark the Buy Zones (BZ) and Sell Zones (SZ) for Trade Entries and Exits. Lower numbered R1, S1. pivots are the more recent ones
CORE STRATEGY (RULES OF THUMB)
| SCORECARD | REQUIREMENT (MIN/ MAX VALUE) |
| Open Interest | ≥ 250,000 CONTRACTS |
| FOR ATM STRIKE FM 100,000 TO 80,000 | |
| Volume: Option chain | ≥ 500 contracts |
| Daily trading volume: ULA/Stock | 1M shares/day |
| Slippage | ATM put/call <0.25% of ULA e.g., if ULA =$100, max. slippage$0.25 |
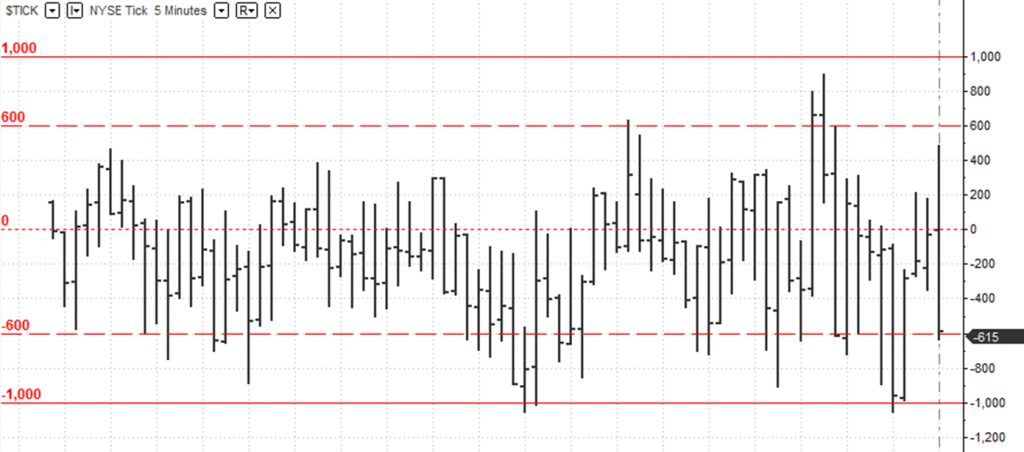
an additional momentum direction indicator: $TICK Indicator
| OPTION PRICE | SPREAD | SINGLE STOCK | INDEX |
| ULA price ≤ $1.0 | max. spread: $0.10 | $0.75 or lower | $1.50 |
| ULA price 1.0≤. $3.0 | max. spread: $0.20 | $0.40-0.75 | $0.75-1.50 |
| ULA price > $3.0+ | max. spread: $0.30 | $0.40 | $0.75 |
When the $TICK hits an extreme reading, this can be interpreted as a contrarian indicator, because when there are too many buyers or sellers the market tends to correct to find balance. Or, if a trend forms within the $TICK reading, this can indicate continuation.
E-mini-S&P 500 Futures – The $TICK – NYSE Tick 5 Minutes: The $TICK; Cumulative up ticking stocks minus those down ticking on the NYSE
Outcome of step 4: Candidate/s for the day determined, alert sent.

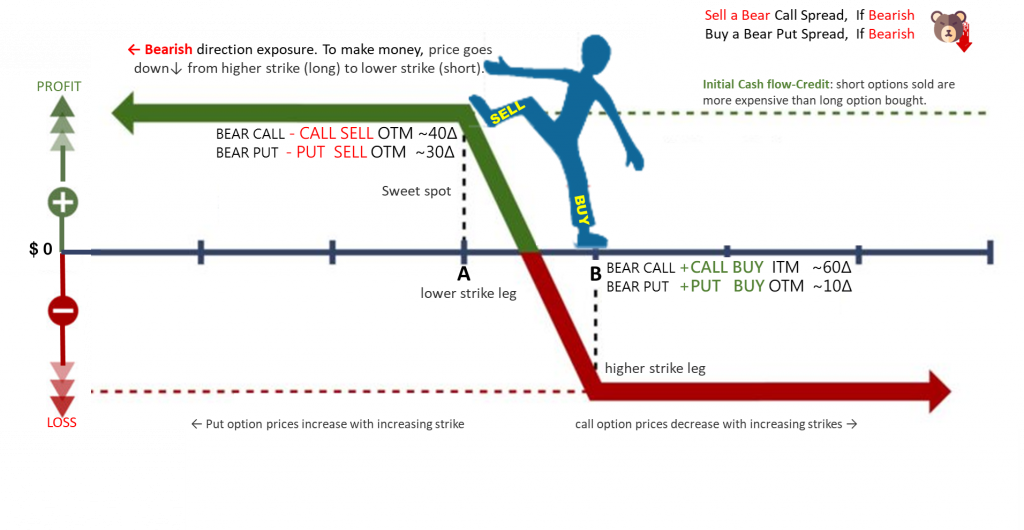
| Scenario | Debit strategies | Credit strategies |
| In addition to catalyst, stock is before support | Credit strategies more Suitable | Sell naked puts or put spreads under support levels |
| In addition to catalyst, stock bounced off support | Buy call / call spreads | Debit strategies more suitable but can sell naked puts/put spreads |
| Stock has high dividend | Buy stock with protective put (married puts) | Buy stock and sell ATM calls (covered calls) |
| Wish to increase POS success | Credit strategies more suitable | Sell naked puts/put spreads |
| Wish to limit risk | Buy calls/ calls spreads | Sell put spreads |
| Sure in the direction | Buy OTM calls /OTM calls spreads | Debit strategies more suitable |
| Maximize ROI (leverage) | Buy OTM calls | Debit strategies more suitable |
| Market is in a strong trend | Buy calls/ calls spreads | Debit strategies more suitable |
| Want to hold position short term | Buy calls/ calls spreads | Sell OTM puts and rolls if challenged. |
| Want to hold position long term | Hold stock and buy put for protection (married puts) | Hold stock and sell OTM calls (covered calls) |
| Stock has strong fundamental base below current point | Credit strategies more suitable | You can sell naked put below the price and hold the stock if assigned. |
 Pre trade management set for each trade


Post trade management: The proactive process for action selection to manage a trade on the 7 basic factors:
- General factors
- Your risk tolerance
- The current market trends
- The other positions in your portfolio
- Your overall portfolio beta-weighted delta
- Your current assumption about future prices of the underlying
- The nature of the option position
- The type of strategy (vertical spread, strangle, butterfly, calendar, etc.)
- The type of risk (defined risk or undefined risk)
- The breakeven values
- Entry metrics
- The maximum profit (MP)
- The maximum risk (MR)
- The ratio MP / DTE
- The probability of profit (POP)
- The buying power reduction (BPR)
- Prices and the Greeks
- The current price of the underlying and where it falls relative to the breakeven values
- The current prices of the option legs
- The current delta and theta of the option position
- Remaining time to expiration
- Current profit or loss
- The current P&L for the position
- The current for the legs viewed separately
- The profit target TP
- Your risk limit current risk/reward ratio
- The probabilities
- The current probability that the position will expire in the profit region Prob (ITM)
- The current probability of touching POT
- The profit region at some time prior to expiration
- The current probability of touching the profit target at some time prior to expiration
General & Portfolio level Management
I look at the net liquidation values for each instrument and for the group. Net Liquidity is the amount of money that would be received or paid if every position were closed (liquidated) at the current market price. The Net Liquidity subtotals do not include uncommitted funds. The TOS platform (I am on IBKR) does, however, provide an ‘”Account” total net liquidation value that includes everything in the account. I pay careful attention to that value. It is the single best indicator of the health of the overall portfolio. I want to see that it is steadily growing.
Checking the portfolio totals takes less than one minute, and it quickly lets me know if portfolio adjustments are needed. It is a time well spent.
- Beta-weight your deltas and closely monitor your overall beta-weighted portfolio delta.
- Keep the size of your portfolio delta manageable and consistent with your risk tolerance.
- Keep the sign of your portfolio delta consistent with your assumption about market direction (negative if bearish and positive if bullish).
- Your overall portfolio delta will change with changes in the prices of the underlying, the volatility of the underlings, and time decay. Seek a daily portfolio theta greater than 0.1% of the overall portfolio size ($1 per $1,000). The Vega column tells me what the expected gain or loss would be for a 1% change in the implied volatility. For example, the Vega value of -$612.65 for SPY in Figure 13.1 means that I would expect the SPY position to lose about $613 for a 1% increase in the implied volatility of SPY or gain about $613 for a 1% decrease in the implied volatility.
- a. Time decay benefits short positions and hurts long positions.
- b. Volatility increases benefit long positions and hurt short positions.
- c. Volatility decreases benefits short positions and hurts long positions.
- Option prices and the magnitude of the deltas decrease with time decay (thus benefiting short positions).
- Volatility decreases benefit short premium positions, and volatility increases hurt short premium positions.
- Large market declines are usually accompanied by large volatility increas
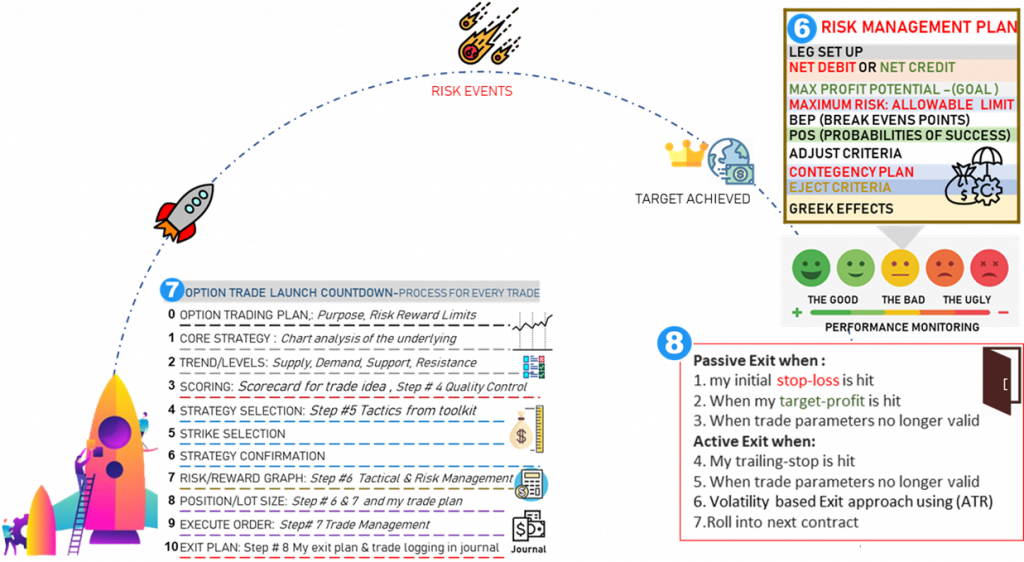
![]() Exit Conditions decision making: Every day, while holding position(s), I reassess whether I remain convicted about the market changing its mind to agree my world view? Is it still greater than remaining time till expiry? If yes, I hold my position, else if I sell/unwind to close.
Exit Conditions decision making: Every day, while holding position(s), I reassess whether I remain convicted about the market changing its mind to agree my world view? Is it still greater than remaining time till expiry? If yes, I hold my position, else if I sell/unwind to close.
Trade Exit Strategy: Where to Target or Exit?
Before executing a trade, I must define my Primary & Secondary Exit Points:
Primary exit: Point sets RETURN ON INVESTMENT (ROI) value that is the price/value at which I will close my trade and hence control my greed.
Secondary exit: Decide on % loss I am willing to accept and to maintain consistent profits or limit losses by controlling fear. The key to maintaining consistent profits, by adjusting them. In order to do this I must have a thorough understanding of the current trend and the trading instruments I am trading.
It is up to me to decide what percentage of my investment I am willing to risk and what percentage return I wish to obtain.
Exit
- If already ITM and/or green i.e. market consensus has already shifted in agreement with you then consider how much more steam your position’s got.
- Is the market still updating in my favor? If yes, I will hold.
- Was my original PT a hit? If yes, I will sell/unwind to close.
- Don’t ever exercise early because I would be leaving $ on the table. Whether my position is -90% in the hole or +400%, that options contract in my hand still has more time value left, so if I sell/buy to close, I recoup the entire time value. If I exercise early, I lose all of it.
- With method approach to targeting, starts with fair value (or the location of all the already filled orders). Fair value to determine targets and managing of the trade can vary considerably, and for good reasons.
- Different timeframes on the same security (thick lines are 420 min zones, and thin lines are 15-minute zones). Each of these targeting techniques could be included in the trading plan, but each may have different reasons for use.
- When to get out of trade? Follow the rule of 50% or 21 days: if the trade reaches 50% of max profit, then it’s time to close out. But, either way, it always closes out at 21 days.