🧠 Expert Trader Explanation
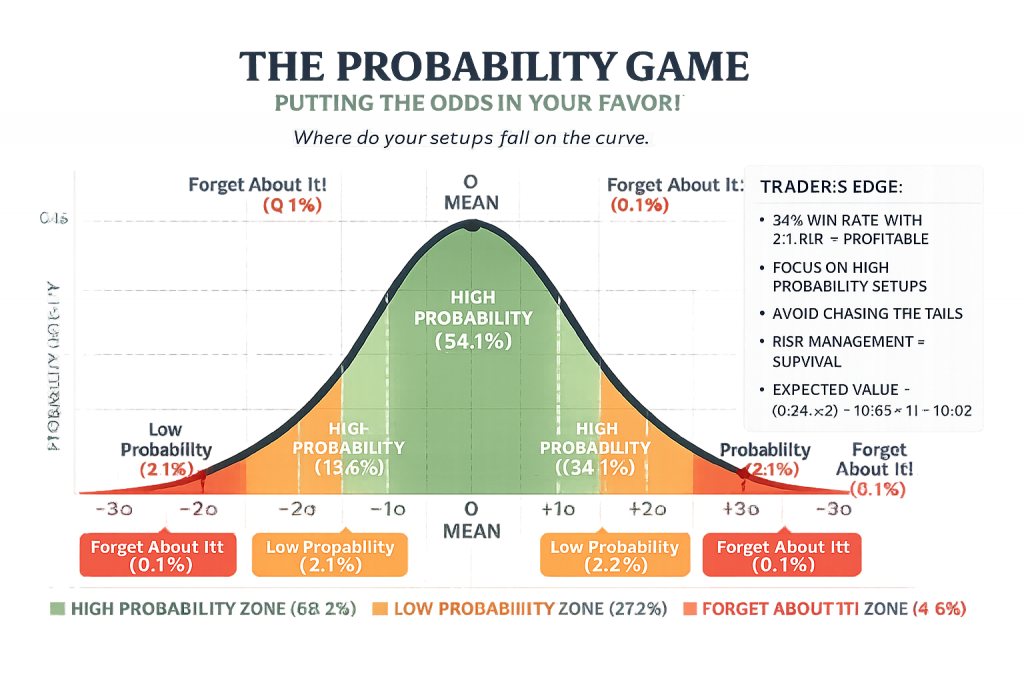
Trading is NOT gambling. It is about probability. However, if you don’t have a plan, you are in fact gambling. Using the probability tools specifically listed hereafter, we can be very successful, for example, a 34% win rate by making informed decisions based on price action and placing the odds in our favor. As we scan charts for opportunities, we will use specific criteria to identify high-probability trades, low-probability trades, and trades not worth considering.
This is a normal distribution (bell curve) overlaid with labels for trader psychology. In trading, we often think in terms of probability distributions — where most outcomes cluster around the mean (expected value), and extreme events (tails) are rare but impactful.
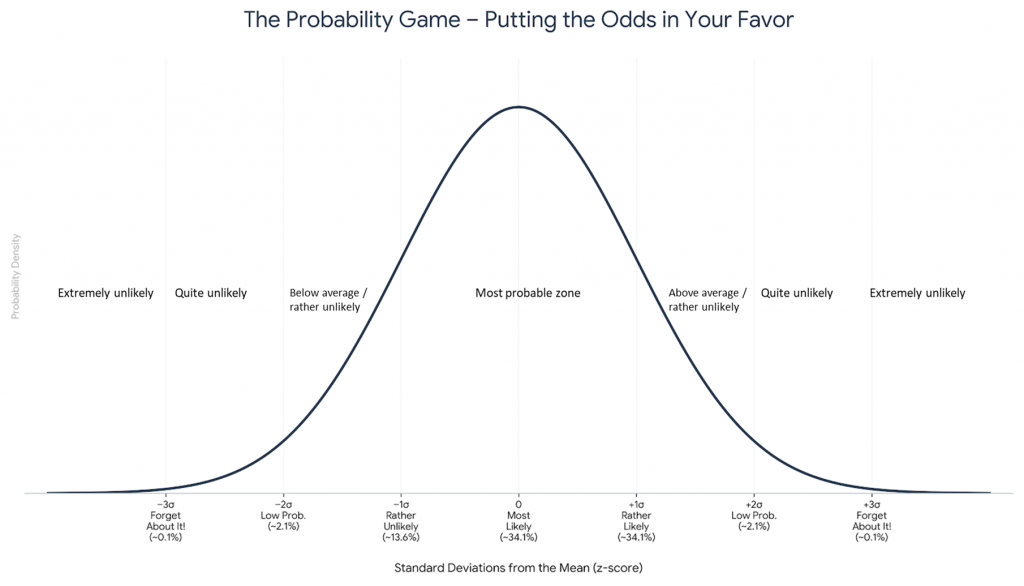
Here’s how the labels map to trader behavior:
- Forget About It! (Tails: -3σ and +3σ)
These are the “black swan” or “lottery ticket” events.- Probability: 0.1% each.
- In trading: A catastrophic loss or a massive windfall.
- Trader mindset: “That’ll never happen again” — until it does.
- Low Probability (±2σ)
These are “2-sigma events” — unusual but not impossible.- Probability: 2.1% each.
- In trading: A sharp move against you (or for you) that feels surprising but is statistically expected every so often.
- Trader mindset: “I didn’t see that coming” — but the model did.
- High Probability (0 and ±1σ)
This is the “meat of the distribution” — where most price action lives.- Probability: 34.1% each for the ±1σ bands, and another 34.1% at the mean (0).
- In trading, Small random fluctuations around the current price.
- Trader mindset: “This is just noise” — and they’re right.
📈 Why This Matters in Trading
- Volatility is measured in standard deviations (σ).
- A 1σ move happens often — it’s the daily grind.
- A 2σ move happens a few times a year — it’s a trend day.
- A 3σ move happens rarely — but when it does, it wipes out under-hedged positions or creates massive opportunities.
The labels reflect trader biases:
- We overweight the tails (fear/greed).
- We underweight the mean (boredom).
- We forget that ‘low probability events do happen‘ — and they matter.
Putting odds in our favour: The 8 probability tools for traders
The essential eight probability-enhancing components that every trader must master. Let me break down each element:
1. PRICE — The Ultimate Truth
Price is the only thing that pays. All indicators, news, and analysis are derivatives of price action. Professional traders focus on:
- Raw price action over lagging indicators
- Structure (higher highs/lows = uptrend; lower highs/lows = downtrend)
- Key levels where price has reacted before
2. SUPPLY & DEMAND — The Engine of Movement
Every price move is caused by an imbalance between buyers (demand) and sellers (supply):
- Demand Zones: Areas where buying pressure exceeded selling (support)
- Supply Zones: Areas where selling pressure exceeded buying (resistance)
- Fresh zones (untested) have a higher probability than tested zones
3. TREND — Your Best Friend
“The trend is your friend until it ends.”
- Uptrend: Higher highs, higher lows → Look to buy pullbacks
- Downtrend: Lower highs, lower lows → Look to sell rallies
- Range/Consolidation: Avoid or trade the boundaries
4. MARKET TIMING — When to Enter
Timing separates amateurs from professionals:
- Higher Timeframe (HTF): Determines direction (bias)
- Lower Timeframe (LTF): Provides precise entry timing
- Confluence: Multiple factors aligning = higher probability
5. INSTITUTIONAL ACTIONS — Follow the Smart Money
Banks and institutions leave footprints:
- Order blocks: Where institutions placed large orders
- Fair Value Gaps (FVG): Imbalances created by institutional buying/selling
- Liquidity sweeps: Stop-hunting before the real move
6. ODDS ENHANCERS — Stacking Probability
Increase your win rate by combining multiple factors:
| Enhancer | Description |
|---|---|
| Multiple timeframes aligned | HTF and LTF in same direction |
| Confluence of levels | Support + Fibonacci + Order block |
| Momentum confirmation | Strong candle closing in direction |
| Volume analysis | Higher volume on breakout |
7. RISK MANAGEMENT — The Holy Grail
You can be right 40% of the time and still be profitable with proper risk management:
- 1-2% risk per trade maximum
- Risk: Reward ratio of at least 1:2 (aim for 1:3+)
- Position sizing based on stop-loss distance
- Never move stops to avoid losses
8. TRADING PLAN — Your Rulebook
Every trade must be pre-planned:
- Entry criteria: What conditions must be met?
- Stop-loss: Where is the trade invalidated?
- Take-profit: Where is the logical target?
- Trade management: When to move to breakeven? Scale out?
The Chart Pattern Analysis
Looking at the price action shown:
| Phase | Description | Trading Approach |
|---|---|---|
| Phase 1 | Accumulation/Base | Wait for breakout confirmation |
| Phase 2 | Markup/Uptrend | Buy pullbacks to demand zones |
| Phase 3 | Distribution/Top | Watch for reversal signals |
| Phase 4 | Gap Down | Likely stop-loss sweep or news event |
Key Takeaway
Professional trading is not about prediction — it’s about probability.
By mastering these tools, you shift from gambling to a systematic approach where:
- You know your edge
- You manage risk
- You let probability work in your favor over a series of trades
“It’s not whether you’re right or wrong that’s important, but how much money you make when you’re right and how much you lose when you’re wrong.” — George Soros