When I get to be a CEO?
![]() Even though I trade part time, I want to “treat my trading as a business“. My trading business is simpler than most businesses as no physical location, no employees, no inventory only capital and the sky is the limit to growth. Because trading is easy to start, there is probability of getting sloppy in managing trading business and eventually to an early closing (aka wiping out entire account).
Even though I trade part time, I want to “treat my trading as a business“. My trading business is simpler than most businesses as no physical location, no employees, no inventory only capital and the sky is the limit to growth. Because trading is easy to start, there is probability of getting sloppy in managing trading business and eventually to an early closing (aka wiping out entire account).
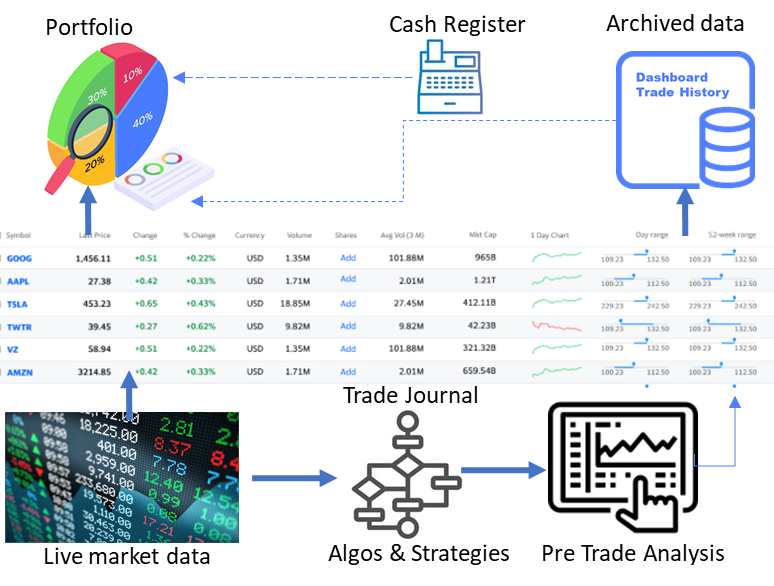
When I treat my trading as a business, then I got to be a CEO. What does an (or any) CEO want? Better results! The CEO of the company does not look at only sales figures but lots of metrics are crunched to know the health of the business. What is the most important objective of any CEO? To increase revenues and thus profits. I have my trading mission, goals and objective in my trade plan. I want to track my profits and losses and grow my business. I use my trade journal to analyze, measure and monitor my trading performance. I hope that I will be able to make better trading decisions by taking into account statistical evidence of what works.
The journal will become a perfect trading history logbook for reviewing strategies and past mistakes and successes. I can journal my trades and my data are backed up and secured. This ‘journalized data’ can be analyzed to identify patterns in my trading and report to me. I can use these patterns to my advantage and thus help me determine what is working for me, and what to tweak. I would be interested to know what “set of trading mistakes” is causing the biggest trading losses?
And finally, it is possible to boost my trading performance, to work on patterns that are working against my performance, by taking corrective action and eliminating or minimizing trading mistakes are making you lose money. I can you can focus on making sure to not to repeat trading mistakes.
The tedious work of entering my trade records to integrate with my portfolio is prompting me to write this post. Additionally, I want to brainstorm ideas to build a portfolio tracker.
Options trading terms: The data columns described further down need some options trading terms defined and understood in options dashboard spreadsheet application. Let us familiarize with most common terms s below:
- Trader ID: create and select different trader IDs to track different trading accounts.
- Date and time data: date format is DD-MM-YYYY to force date formatting at application level, I have implemented a function at open the google sheet.
- Date Initial Open: is the actual date that the option contract was opened or the new position was established.
- Transaction date: when the position was (is) opened. transaction date (or log date) which can be different from the initial open date when the transaction is an adjustment to the option contract (e.g., rolling out in time or adjusting the strikes)
- Expiration Date: is the expiration date meaning the date that the contract is scheduled to end.
- Initial days till Expiration (Init DTE), the number of days left on the option contract, when the position was opened (on the transaction date).
- Days to expiration (DTE): the number of days left on the option contract with respect to current date,
- Close Date: The day you either exited your option play or it expired.
- Stock symbol (or Ticker): The ticker symbol for the stock underlying the option contract, used to identify the stock on the stock exchanges and relevant websites such as Yahoo finance.
- Underlying Price: is the underlying stock price at the moment the position is opened on the transaction date.
- Transaction Type Open/close: B/S Buy or sell the option? The type of Transaction to open a position is either Sell to Open (STO) or Buy to Open (BTO).
- Strategy: dropdown choice of the selected the strategy of the trade, such as put, call, strangle, iron condor, iron fly, call spread, put spread, jade lizard and big lizard.
- Strategy Description: I use this field to make a brief description of the trade is that I can quickly identify the trade.
- Strike price: is the set price of the option contract at which the underlying stock can be bought or sold when it is exercised.
- Implied Volatility Rank Open: IVR (Implied Volatility Rank) of the stock at the moment the position is opened on the transaction date.
- Probability of Profit (POP): Probability of Profit and it gives expressed in percentage the expected chance that the trade will have a positive result, will be a winner.
- Quantity (Qty): stand for the quantity of contracts for the newly opened position (default value is one).
- Premium Open: Premium received (credit when selling to open), is the money collected for selling the global position. Since contracts are transacted in increments of 100 shares, when I enter the option premium of $1.23 in this field, I actually have received $123 in premium.
- Total Fee Commissions: Total Fee and Commissions amount that has to be paid to brokerage for executing the transaction. From the settings section, I should be able to control commission rates and Contract Time as at either Exit Time or Entry Time. I could define different rates per broker, as fixed rate, however with IBKR I have settings section of the trade journal where I enter different commissions for each row manually.
- Cash-Secured Put (CSP Cash Reserve): the amount of money needed to be on hand in order to sell the option. For a non-margin account, the total amount that needs to be in the account before your broker allows the trade to go through will be 100 x the strike price. This is why this is called a cash-secured put.
- Put Margin Reserve: the amount of money needed in the account for a naked put sold in margin account. Most brokers calculate this as (25% of the underlying stock’s market value + the option ask price – any out-of-the money amount) x 100 (per contract) x the number of contracts.
- Call Cost Basis/Share: Calculating the rate of return (ROR) is tricky. When selling covered calls, the annualized rate of return is based on the strike price. It does not take into account any gains or losses from selling the underlying stock. I did this to keep this spreadsheet dedicated to profit/loss only related to options. Stock transactions are performed in a similar way. This can be changed by editing the formula in the relevant column, if required.
- Buying Power Requirement (BPR-Margin Requirement): Buying Power requirement – Margin Requirement, is the actual cost of the investment, also a determining factor for the return on investment.
- BPR % of Net Liquidity: Automatic calculated control field that checks if the % of the position is not higher than the set percentage in the portfolio goals.
- Implied Volatility Rank (IVR) @ Open: Implied Volatility Rank of the option at opening – interesting parameter to follow up the evolution of the volatility of the position.
- SPY Beta Weighted Delta @ Open: The delta (SPY Beta weighted) of the option at opening – interesting parameter to follow up the evolution of the total portfolio delta.
- Call: or put: What type of option?
- PRICE DATA:
- Stock price DOC: Underlying stock price at the time you opened the contract.
- Current stock price: The stock price of the underlier today.
- Break-even price: The price the underlier has to reach for the option play to break even.
- Total Credit or Debit: calculated field of the opening transaction
- Strike price: The strike price of the option.
- Premium: Option price.
- Fees: All transaction costs for each trade including commissions.
- Exit Price: The price you exited your option play.
- P&L DATA with account data:
- Account: The account the option trade is executed in if you have multiple accounts like one for options, one for stocks, IRA, or Roth IRA and trade option plays in each
- Contracts (lot): Quantity of contracts held or sold in the option play.
- Profit/Loss: How much you made or lost on a trade after it is over. Dark green for profit and red for a loss.
- Annualized ROR for Options: Calculates the annualized rate of return on the option play.
- Margin Annualized ROR: Calculates the annualized rate of return based on the smaller margin cash reserve.
- Status: Whether a current option play is open, closed, or exercised.
My options trading journal
High level view of my option trading dashboard:
• Option Tools like Greek calculation, expected move (EM), Std deviation calculation (local) and trade simulations
• Dashboards and Reports with Charts
• Automate Jobs with GAS (Google App script)
• Solver Add-in & Statistical Analysis
• Data Entry and Lists
• Portfolio management
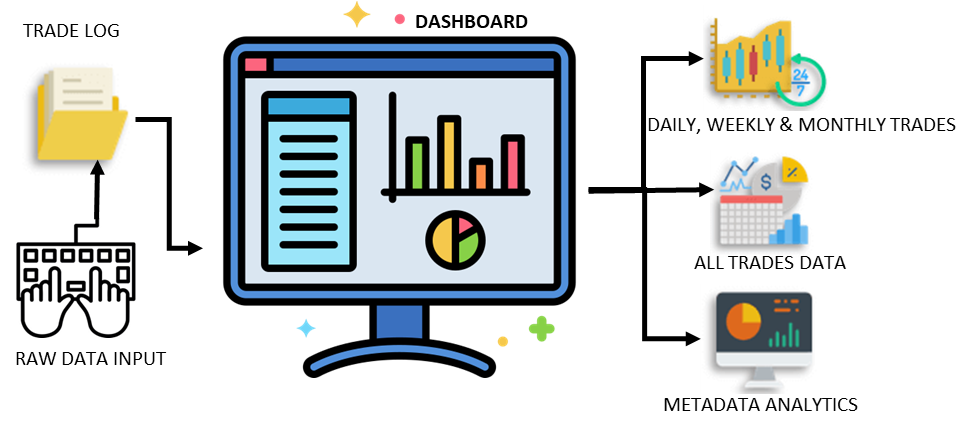
Raw Data Input: This is where I can import raw data from my broker IBKR. Usually, I enter trade data manually for each trade.
Auto calculation: This is where raw data is calculated, filtered, and displayed per transaction. This section is being populated from Raw Data Input.
For my options trading dashbord spreadsheet app, the realized profit or loss is calculated when the option trade is actually status changes to ‘CLOSE’ i.e., completed. For example, when selling a premium, the premium collected as profit is only realized (calculated) after the option position is either goes through assignment, expiration or closed through buy to close (BTC). This keeps things simple. If I roll an option position, first finalize(close) the existing position with buy-to-close (BTC) and then open a new position with tag ‘ROLL’. The entire trade is logged in a single row.
Daily, Weekly, and Monthly Dashboard:
Here the Option Dashboard displays the weekly/monthly performance of my trade transactions.
Metadata Analytics:
This section is populated from the data you input on the right side of the Trade Log. (You can edit these metadata drop-downs in the Settings section)
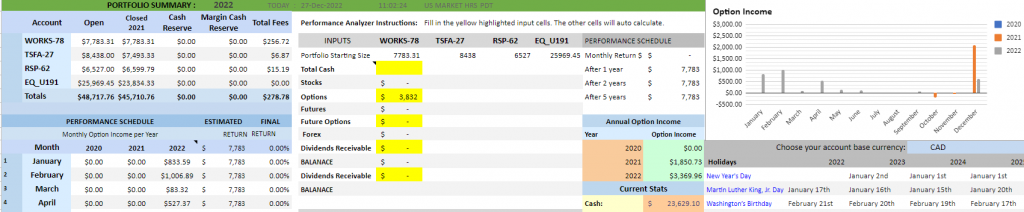
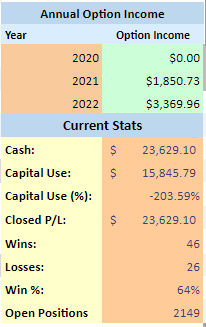
The Summary sheet automatically calculates the total profit/loss that is both realized (and unrealized trades are not reflected in p/l as unrealized), the cash reserves for the open trades, and total fees. In future updates I am planning to connect my Forex trades and dividend tracker to a table displaying daily, weekly monthly income.
Technology: Google spreadsheet
Analysis type:
- Quantitative analysis
- Qualitative analysis
- Statistical analysis
- Descriptive analysis
Expertise
- Math
- Statistics
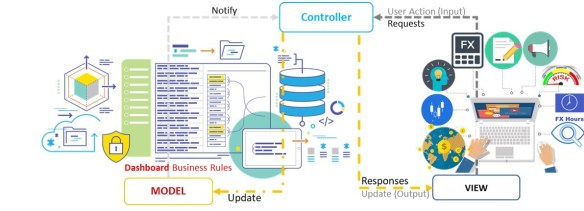
Application model: Server-side Model View Controller (MVC) pattern. Many of its components and concepts will seem familiar to those of us with experience in other web frameworks
Business Rules of option dashboard:
Rule 1. bought and sold quantity/ amounts should belong be the same for a ticker.
Rule 2. The contract’s exit date of a trade is the date when a position gets closed, regardless of when this position was initialized.
- If I leave it exit date empty, the option dashboard will treat these transactions ‘open’ trades due to open position.
Rule 3. When calculating ‘Put Cash Reserve’ and ‘Put Margin Reserve’ check the status:
- if the option status is still ‘OPEN’, then cash reserve is ‘locked’ for trading.
- If the option position status is ‘CLOSED’, meaning no need for the reserve, that capital is available for trading. The accounts section should indicate a lower reserve.
You can still update the dashboards. Just know that this trade will be excluded while calculating profits and other metrics. Note that you can continue buying and selling the same ticket/symbol. Position will get closed once balance reaches zero.
Rule 4: Covered call rules. Whether CC is expired worthless, assigned or bought back prior to expiration. spreadsheet should calculate it automatically. For the Current Profit following formula can be used (with required data fields):
S = the stock price,
C = the Lot size (number of sold calls)
V2 = the current value of the sold calls,
X2 = the max P/L (max profit or loss)
fee = the fees and or commissions.
=IF (Stock Price, IF (LOTSIZE CALL < 0, Current_Value_Call + MAX_P&L, Current_Value_Call – fee),)
Rule 5: Vertical trades Bullish and bearish spreads rules:
How the Vertical Trade call or put Works: The Spread option trade strategy is employed when the trader thinks that the price of the Underlying asset will go up or go down moderately in the near term.
Bullish spreads implemented by buying an at-the-money option, and selling out-of-the-money option of the same underlying security and the same expiration month. I have decided to implement spread business logic by dividing spreads into two categories, credit and debit spread. Following Strategies Used Based on Stock Movement:
- Bullish Strategies: When Stock is expected to move upside, following strategies are traded:
- Long call +C: Debit
- Bull Call Spread +C-C: Debit Spread
- Bull Calendar Spread +C -C: Debit Spread
- Bull Put Spread -P+P: Credit Spread
- Bearish Strategy: When Stock is expected to move down side, following strategies are traded:
- Long put -P – Debit
- Bear put Spread +P-P: Debit Spread
- Bear Calendar Spread +P-P: Debit Spread
- Bear Call Spread -C+C: Credit Spread
Spreadsheet tabs in the spreadsheet: the logbook or tracker of all transaction data, the results page with the very useful possibility to filter by period, trader and account, the third tab is the portfolio overview and the last tab is the instructions tab. Let’s take a look.
Spreadsheet fields to track with my options trading journal for data entry and calculation fields.
Do not delete row 2 as formulae in row 2 would be impacted and render sheet useless.
Create dynamic charts
Using Pivot Table to aggregate data.
I can create a Pivot Table from the dataset (table of Option trade data), all of the columns from the dataset are available to use in my pivot tables.
Adding pivot tables to create eight dynamic charts, one for each chart or value we want to display on the dashboard. Below is the configuration used for each charts Pivot table:
- Daily Profit and Loss (pnL)
- pivot table data field for rows data: trade exit date
- column
- values: sum of total gains
- Winning trades %
- pivot table data field for rows data: trade exit date
- column:
- values: sum of “account profit”
- Average gain / trade
- pivot table data field for rows data: trade_id
- column:
- values: sum of “win” (count win)
- Average gain in %
- pivot table data field for rows data: (proceeds aka gain_amount)
- column:
- values average of gain amount
- Total profit amount
- pivot table data field for rows data: gain amount
- column:
- values: sum of gain amount
- Total trades
- pivot table data field for rows data: trade id
- column:
- values: sum of trade id
- Long and short trades
- pivot table data field for rows data: Trade id,
- column:
- values: sum of trade id by trade type
Adding slicers
Select any of the pivot tables to show the field list.
Right-click on Months and select Add as slicer
Right-click on Years and select Add as slicer
Creating the Charts
Add a Line Chart for the accumulated profit (different chart type and styling possible)
Add a chart using the same method for Daily PnL, for example a Line Chart or a Bar Chart
Add a chart using the same method for Long/Short, for example a Pie Chart
When done you should have 2 slicers and a few charts on the Pivots sheet.
Creating the Dashboard:
After the charts and slicers, next step is to create the dashboard on a new sheet or existing and name “Dashboard”
Start with an overview, about what needed to be displayed on our dashboard day to day. I have included Total P&L, realized P&L and win-rate. I can expand later to include other metrics and parameters that I am going need for further record keeping like, expiration or being assigned, total risk etc.
Data is derived from the pivots sheet, copy and paste the slicers and the charts (not any data from the sheet) on following fields:
- Total PnL
- Wins
- Avg gain / trade
- Avg gain / trade %
- Total trades
Features of portfolio tracker:
Important /must features:
- Watch lists
- Managing Portfolios
- Setting Automatic Commissions and fees
- Track Trades
- Add Setups, Mistakes and set Risk Reward Ratio
- Understanding Trade Results
- Managing Trades Table
- Bulk Actions
- Understand Tendency Performance
- Journal Trading Days
- Use Filter
- Find Profitable Trading Pattern
- Review Your Monthly Performance
- Setup Automatic Targets and Stop Losses
- Build a Trading Plan
- Tracks all financial assets held
- Tracks portfolio diversity
- Tracks dividend income
- Tracks option premiums amounts
- Includes trading calculator (with Projections)
- Captures P/L from all sales
- Computes account cash/margin balance
- Displays monthly income/expenses
- Compares year over year performance
- Alert parameter on field DTE: Days until Expiration and is the number of days left on the option contract, at current date (today). This parameter will trigger alerts to manage the position (e.g., IF; DTE < 21 days THEN; “manage trade” alert).
- Recommended Action: field trigger to “wait” or to “manage” position based on target variables:
if DTE < 21 days then, “manage”
if NetProfit > 50% then, “manage”
else “wait” - consolidation trades from underlying transactions and calculates trading performance metrics and various monthly statistics to follow up on.
- If you want to use it with excel you can export the resulting trade information.
- Microsoft Excel trading journal using pivot tables can also be used as a dynamic dashboard. Trade data can be imported.
- “Trade consolidation from underlying transactions“: It takes “options trades” and automatically group into spreads, calendars, long shorts, etc.,
- Expire and assign options contracts: auto expire and assign your contract.
- Rolls: manual, by closing a position and re-opening with the new options contract.
- performance metrics measurement: such as win % and gain based on spreads instead of individual trades.
- Options on futures contracts: minimum support for the following contracts: ES, GC,SI,CL,NQ,MES,MNQ,RTY,M2K,MYM,YM,KC,KE,LE,SB,ZW,ZC,ZB,ZN,SF,OJ,ZM,XW,XK,ZC,QQQ, Forex/currencies future contracts 6E, 6B, 6E*
- Analysis: What assets or asset classes are most profitable
- Track pnl on longs vs shorts
- Track performance based on timeframe and trading style
- Closing an option position
Wishlist (not necessary, but desired)
- Multi portfolio tracker • Trade analytics • Back tester • Simulator • Charting
- Personal diary • Back office • Research • News
- Merge your spreads
- Spreads can have many legs and trades within them. show merger values like avg leg price, cost basis, credit/debit values as well as p/l for the entire spread.
- Auto-plot entry/exit points on a chart
- The underlying chart will show bought and sold contract prices.
- Establish a ‘daily loss limit’ rule of thumb: The ideal value to establish a daily stop to limit “normal” and technical losses.
- Changing Themes (not at all important just cosmetic, dark theme to save phone battery)
- Upload Screenshots: Upload screenshots of trading platform to recall exactly why I took the trade.
- Calculate gains on a covered call position
- Covered Call complex trades with a married put or collar in CC investment strategy.
Trading metrics
Overview of monthly results
Monthly numbers in dashboard:
MONTH MM YYYY: +/- $ Currency e.g., September 2022 +$ 500
- Qty of positions closed
- Qty of closed with net profit
- Profit Success Rate: __ %
- Total Net profit for positions closed with a profit: $
- Total Net loss for positions closed with a loss: – $
- Biggest Net Profit: +$
- Biggest Net Loss: –$
- Average number of days till expiration on opening: __. __ days
- Average number of days held for the closed positions: __days
Win rate vs Expectancy:
The win rate is x%, which means the percentage of trades that net gained. The win rate doesn’t give a complete picture of trading performance.
Expectancy: takes into account the average size of gains and losses, giving a better picture of portfolio performance.
Past performance
The trade tracked by:
- Date (e.g., all trades from YYYY to YYYY).
- Instruments (e.g., all trades on AAPL, ESZ16, EURUSD).
- Strategies (e.g., all breakout trades, verticals, condors).
- Swing trade, day trade, instrument rankings over time and more.
Modules: Options Tracker → Data
setup for access to the application’s data layer to interacts with the database,
to enable the SQL database tests asynchronously
Module: Account→ Position→ Attributes
This module defines variables for creating entities via the Options Tracker → Accounts context.
- Position attributes:
short: true, false
count: 1
exit strategy: “some exit strategy”,
expires at: DD-MM-YYYY
Fees COMM: $0.00
notes: “some notes”,
opened at: DD-MM-YYYY
premium: 1.50,
status: open,
stock: “XYZ”,
strike: 120.5,
type: call, put - cash: “$”
exercise fee: $
name: “some name”
opt close fee: $
opt open fee: $
stock close fee: $
stock open fee: $, - Current premium: is the current option price. Updating the premium price will adjust the alert triggers that I use in the spreadsheet.
- Current Beta Delta: is current delta (SPY Beta weighted) of the option to follow up the evolution of the total portfolio delta.
- Unrealized PL: actual Current Net Profit/Loss based on the value of the current premium.
- % Max Profit: percentage of the maximum possible profit that is calculated based on the current premium. This field helps to determine if you want to manage a position based on the targets (e.g., close at 50% Max Profit or close at -200% loss)
Closing an option position
D_Close : is the transaction date (or log date) which can be different from the closing date when the transaction is an adjustment to the option contract (eg rolling out in time or adjusting the strikes).
TrType Close: Transaction Close Type and is the type of Transaction to Close a position is either Buy to Close (BTC) or Sell to Close (STC) or ROLL when rolling the position.
UL Price @ Trans: is the underlying stock price at the moment the position is closed on the transaction date.
IVR @ Close: is the Implied Volatility Rank of the stock at the moment the position is closed on the transaction date.
Quantity: the quantity of contracts for the closed position (in my case practically always just one). If a partial close is made, a new position must be opened with the remaining quantity.
Prem Close: premium paid (debit for buying back to close) or received to close the position.
Trans Fee Comm: Total Fee and Commissions, and is the amount that has to be paid to your brokerage for executing the closing transaction.
Total Credit – Debit: calculated field of the opening transaction
Days Held: is the calculated field of the number of days between the opening and closing of the position.
Comments: field used for any useful comment for later review.
Net P/L: a calculated filed of the realized net profit or loss
ROC %: a calculated filed of the realized return on investment expressed in percentage for the net profit made on the investment cost in the field margin requirement.
Ann ROC %: a calculated field of the realized, non-compounded annualized return on investment expressed in percentage for the net profit made on the investment cost in the field margin requirement, taken into account the number of days the position was held.
Commercial paid solutions
- Trader sync (https://tradersync.com/)
- K info (https://kinfo.com)
- tradesviz.com
- https://options-tracker.com/
- https://trademetria.com/
References:
- https://www.twoinvesting.com/2016/10/options-tracker-spreadsheet/
- This is my starting point to pick up basic idea, Scott @twoInvesting decided to share his Google sheet stock and options trading journal. There is lot of discussion on his page about trading journal.
- Reddit Journal wiki https://www.reddit.com/r/options/wiki/toolbox/links/#wiki_trading_journals_.26amp.3B_record_keeping
Leave a Reply