The trading mindset of a traders is ‘automated learned behavior’ to trade following strategy or strategies. For example, one of the strategies called ‘Trend following’ with an objective to ‘find the market imbalance’, that is supply and demand, this is sub-goal of ‘your trading plan’!
This trading mindset is to help me think like a professional Forex trader. One of the requirements for using this tool is ‘a trading plan’, from the ground up. Trading plan includes ‘goals and motivations’, ‘personal strengths and weaknesses’, routine, ‘develop positive habits’, system (personal, don’t borrow or copy from anyone!), review and evaluation of results, (rules – dos and don’ts).
What to trade?
Forex traders can focus their attention on 28 of the major pairs. Best Currencies to trade are 8 major (AUD, GBP, CAD, EUR, JPY, NZD and USD) and their 28 cross pairs.
Why these are best Forex pairs to trade?
Forex market is about $5.3 Trillions per day it is biggest of any asset class! Trade volume in Forex is concentrated mainly in the US Dollar, Euro and Yen. USD makes up to 85% and EUR about 40% of Forex trading volume. Japanese yen JPY takes third place at 20%, followed by GBP, AUD, CHF, NZD and CAD.
This kind of good liquidity makes it easy for traders to sell and buy currencies. Also, many if not all, major pairs can have long, well-defined trends that respond well to technical analysis and charting methods.
My dashboard logic explained in four steps! FOREX (Fundamentals, Orient, React, Execute)
Step 1: Fundamentals – ‘Forex market under the microscope’
- Can I trade today? calendar how many red reports today? Red reports= active day, big financial Institutions and banks
- Big picture who is in control? Sellers or buyers? Weak and strong pairs? Where is the flow of money?
- Underlying conditions where is the market going?
- Correlations?
- How my day look like? If waiting for retracement (V-formation) or rally for entry?
Information sources:
- Stoq.com -indexes (EUR, GBP, USD, JPY)
- Stock charts- (FTF and FX market summary)
- Investing.com technical analysis
- Finviz- relative strength, forex performance
- Oanda-heatmap & volatility
- FXCM-analysis, trading signals & current market action
- Mataf, myfxbook – correlations
- Dailyfx -sentiments,
- IG- Client sentiments
- barchart -Heatmap
- Ringgold- rsi (h,1d, 1w)
- Trading view- fx signal finder
- Forex factory – economic reports, earning calendars, months to watch January, April, July and October
- Yahoo- customized watch-list
- Google- price and historical data
- Ino.com- morning report and snap shot
Documents to watch fundamentals:
- Weekly major charting
- Snapshot ‘use: pair selection cheat sheet’
Step 2: Orient current market action from step one fundamentals
Use: decision-making-work flow
Price action, charts, indicators and screen saver.
Step 3: React-trade plan & decision
Use: ‘decision making process’
Price action, bias, patterns, sentiment, volume (note: volume information is not reliable)
Confluence on a chart: a uptrend ↑ or a down trend ↓;
- 18 & 50 EMAs on the DS charts for trend and dynamic supply and demand levels identification
- Pullbacks: (a) establish strong main trend adx-10 period (b) short trend to entry trigger buy/sell (c) short trend snap back to main trend RSI 5days, Bollinger bands lower end. (1.5, 10days)
- Classic static: (horizontal line) support and resistance levels. Significant price action event areas. Strong directional movement or it can simply be a rejection of a level RBR, RDR, DBR, DBD 50% to 61.8% retrace levels
Step 4: execute – sizing and setup from decision-making process & flow chart
Use ‘trading logic & work flow’
Question: How many trades? Answer: Not more than 3 crosses, 3-day-trades and 1 weekly trade
Screening Norms:
- Currencies to trade: only trade 8 major and 28 cross pairs.
- Screening Norms for selecting fx pairs: Spread pips less than or equal to 2 or 5(with commission).
- ATR: The daily ATR must be ≥50 pips and weekly≥ 200.
- Positive Rollover Interest is highly desirable but not necessary for wealth trading.
Context: When you look up at the chart, ask the following questions;
- Is the trend up, down or sideways, on a daily chart?
- Where are the best quality supply and demand zones for market timing?
- Why is this trend in the market direction? (Context at economic reports, levels and others).
Primary Preparation:
- Establish the major trend on 1M (monthly, this is part of my trading plan, my HTF is 1M, what is yours?), then get major(extreme) supply and demand levels. Do not take trade into these zones! These are extreme boundaries for current price-action-run. These zones are called curves.
- Go to weekly chart (1W) and find the main trend (ITF).
- Then go to Lower Time Frame, mine is daily(1D) to draw minor supply and demand zones with proximal and distal lines. You execute and manage your trade here.
Action and Execution:
- Decision making for trade action, as per the following diagram.

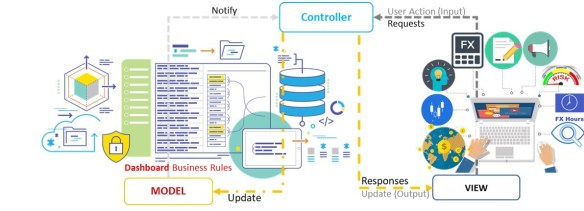
Forex Dashboard App
I am developing an app based upon Google Sheets (spreadsheet) to help visualize and automate quick pair selection after qualitative analysis for Forex trading opportunities. I call it FX Dashboard, still in beta, I have been testing it for six months and the results are encouraging!
Getting Started:
These instructions will get you a copy of the spreadsheet up and running in your own Google account.
Prerequisites:
You need a Google account to make a copy of this spreadsheet and store it in your Google drive.
A Forex Brokers account is required (if you are learning get a paper demo account). FXCM and OANDA are highly recommended.
Installing Dashboard:
- Send me an email (Gmail id preferred), I will forward you link for the FX-Dashboard, that is a google-sheet App.
- Google sheet will ask for your authorization the first time you open the sheet. This is normal and nothing to be worried about. The sheet cannot modify your Forex account in any way. If you are at all unsure, you can cancel the authorization at any time.
- When you click on it, the following is googled sheet acceptance walk through for your use: Authorization and installation in 4 easy steps
Introduction to Dashboard:
- Daily ‘price graph’ for 7 days
- EMAs 200, 100, 50 and 20 periods.
- Monthly, weekly and daily percentage change for the pair.
- Proprietary data (INO.COM) with ‘trend strength number’ from +100 is strong uptrend to –100 strong downtrend and 1M, 1W and 1D trend direction detected.
- Daily High/Low price range
- YTD (Year to Day change%)
- Cross currency pair name
- The current price (15 minutes delay, via google server)
- Trend detection via 20 period ema. If square is green then, ema is below price, however on red square 20 period ema, it is a down trend with price bars lower than ema line.
- The ‘Major Currency’ and its daily /hourly rank (from one to seven, USD is always 0; in the middle!) out of 8 currencies, If number is 1 or 2 with currency in green, this means two of top performing UP Trend currency. Numbers 6 and 7 in red font represent most downtrend currencies. This means if you are like to trade on shorter time frames 1H or below, choose two majors that are strengthening (i.e. rank 1 and 2), and two weakest majors (with number 6 and 7). For currency strength snapshot go to Finviz, or RINGFINZ tab of the Fx Dashboard.
- Today’s economic reports the number of reports for a major to be released today. If ‘REPORT label is in red background, then High Impact Report (HIN) and Medium Impact Reports (MIN) are impending today.
Please note that the signals are optimized for monthly, Higher Time Frames:
- Trading Alerts – Only execute intra-day trades on 1D daily time frames.
- Long Term Trading signals – Signals last up to a few days.
Future Signals updates:
- Pair – The relevant currency pair
- Action – Trading signal, telling you to BUY (in green) or SELL (in red) a pair
- Stop Loss – An automatic exit point to protect your investment. This is the suggested price at which to exit the trade in case the market goes against you. Make sure you apply a Stop Loss when opening the position in your trading account.
- Take Profit – This is the suggested target price at which to exit the trade. Once the rate hits ‘Take Profit’,
- Status – The current status of the signal. Let’s review the possible statuses:
- Active: this status means it is an open signal. As long as a signal is active, traders are advised to follow the alert and enter the market!
- Closed: meaning the signal is no longer active and has been closed by our system.
- Get Ready: be prepared. There is a good chance that the system is about to open a new position. The ‘Get Ready’ signal might become ‘Active’ or disappear
- Comments – Live updates on changes in Stop Loss, Take Profit or Status.
Disclaimer: FX Dashboard comes with no warranty whatsoever. If you use it as Forex pair selection trades, or elsewhere, you do so completely at your own risk.
Leave a Reply