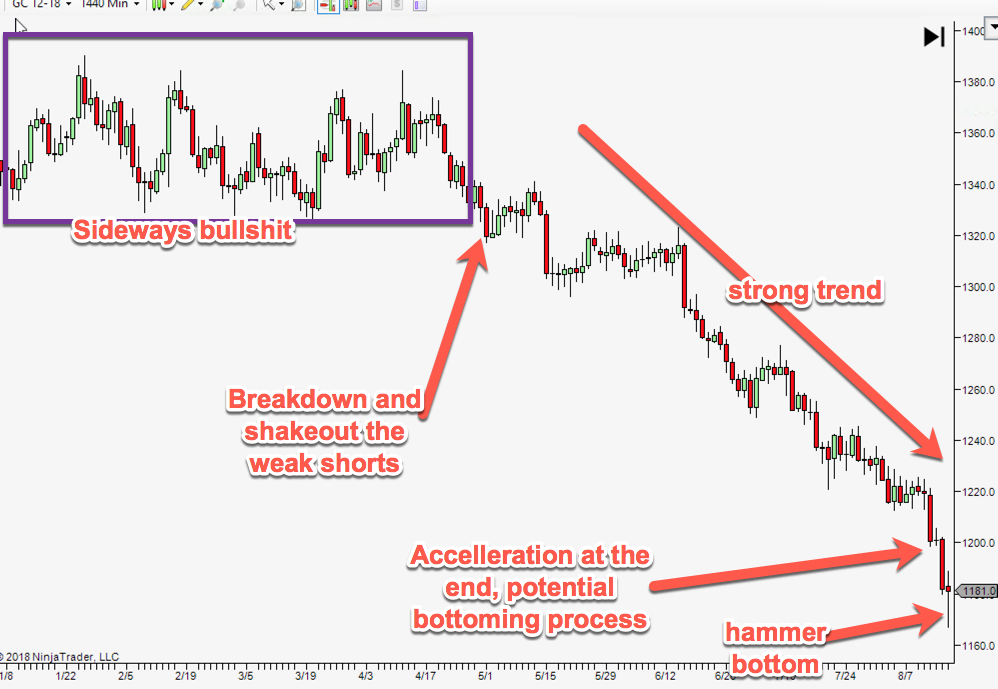
We have accumulating evidence that the bear trend might either be over, or starting a multi-week pullback. Let’s look at what happens going forward and see if the evidence is consistent with that |
Some crucial information that you just don’t get without reading the price action.
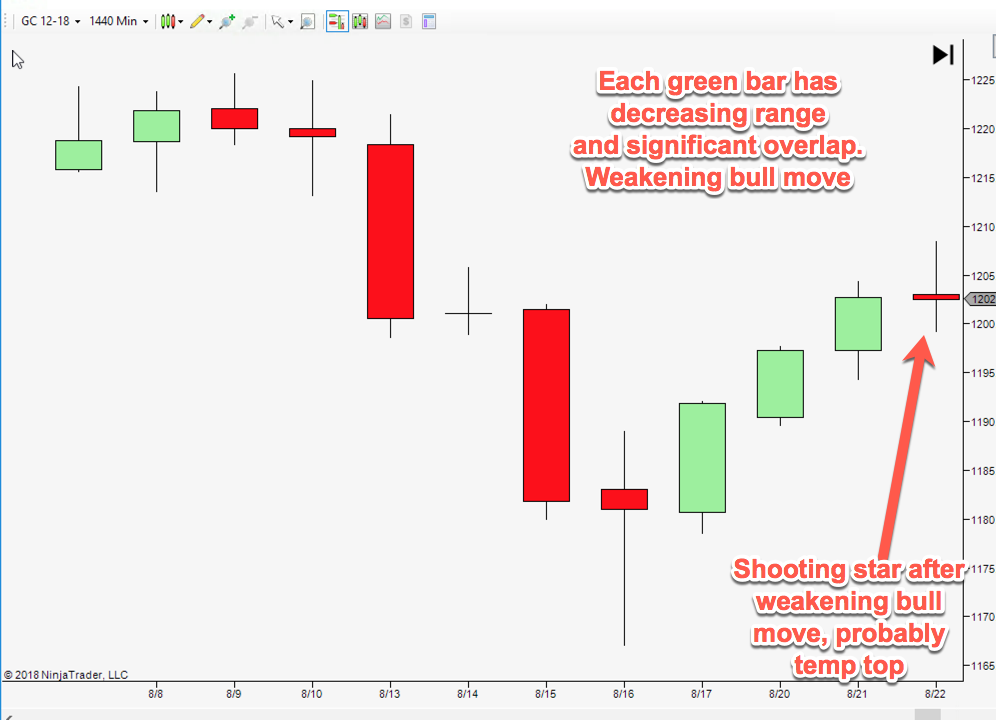
The first bar off the lows is pretty strong, the next is weaker, then weaker still, and the 4th bar off the lows is weakest of all.
What do I mean by weakening?
Smaller ranges. More overlap. And look at the upper wicks. The first bar has no upper wick. Second a tiny upper wick, third a bit more, and the fourth bar is a shooting star with a big upper wick.
An upper wick is the visual representation of selling pressure at the end of the day. Conclusion is that selling pressure is getting stronger.
You ONLY get this kind of granularity and detail by reading price action, you simply don’t get it from traditional technical analysis.
So at this point what do we have?
A potential bottom, with a weakening rally running out of steam. At this point the odds are strong that the bears try and push the price down the next day. If it pushes below the old hammer low, then we probably start a new leg down. If not, we remain in limbo.
Next bar.
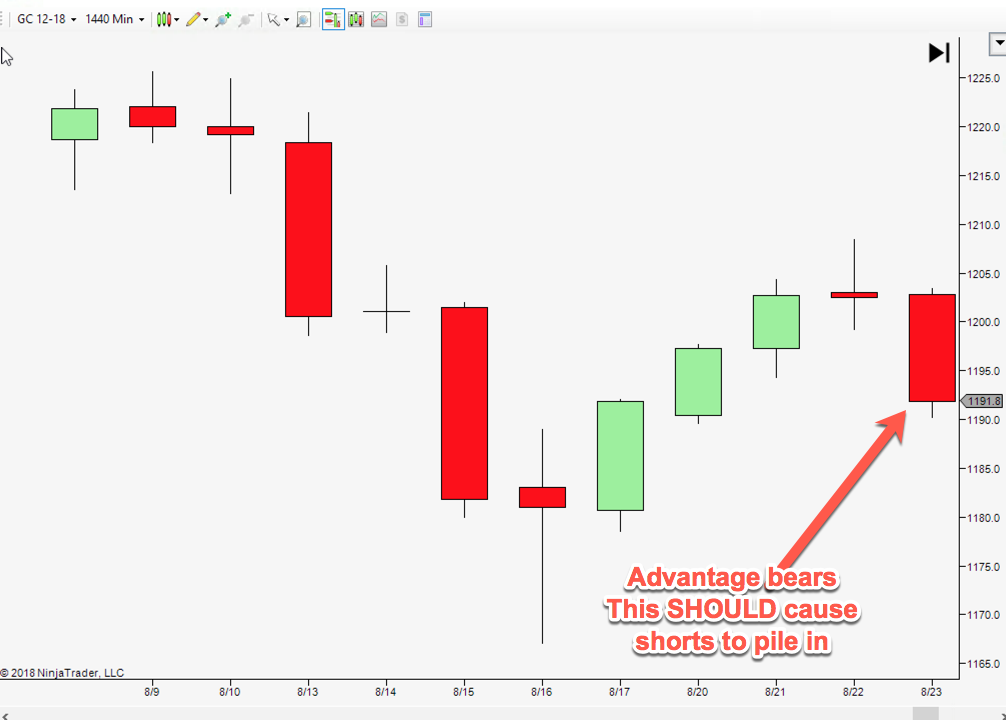
So to be clear. The last 5 bars have been entirely consistent with a bearish trend. If you are a bear and you see that, it WILL make you want to short. So if the bear trend is valid, we SHOULD see an increased range to the downside. The odds favour this.
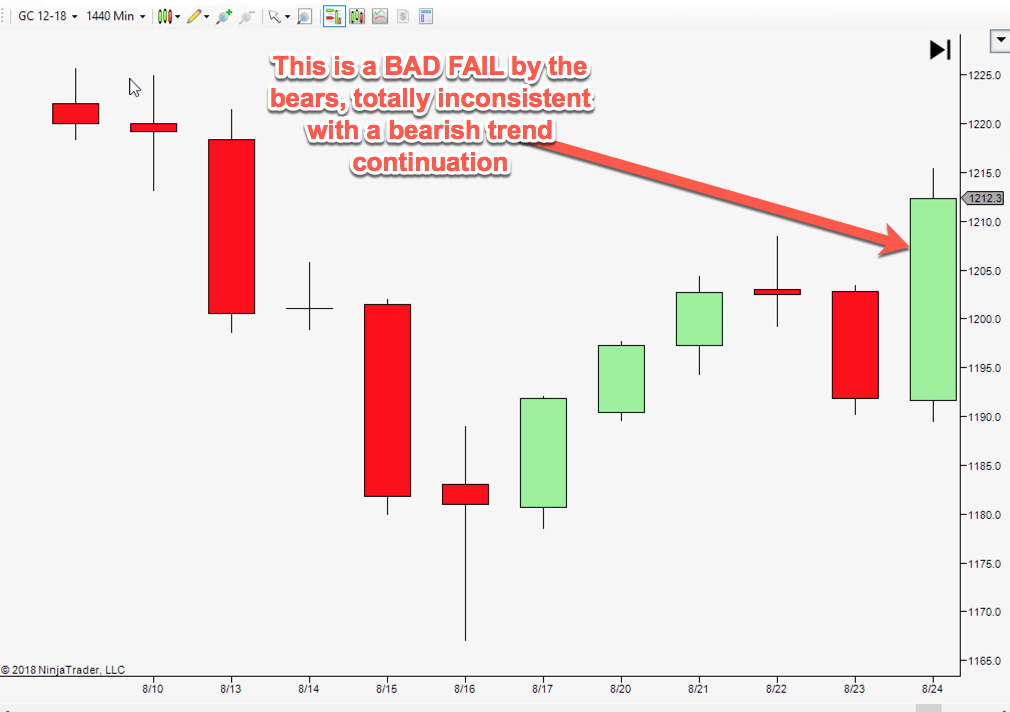
Welly well well.
That’s the fuckin candle right there! Big clue! Game changer.
Why? It’s totally inconsistent with the “new leg down” theory.
Look closer. See how the green bar on the right broke the daily lows FIRST and then reversed and rocketed up, closing above the old highs?
What’s the significance? Well breaking the daily lows SHOULD have made bears short even harder. But the opposite happened. If the opposite to what we expect is happening, then something is different under the surface of the market.
Also, the obvious place for bears to place their stops was at the shooting star candle highs. Not only did we stop those guys out, but the close held ABOVE it.
When the market breaks through and CLOSES above a key level it implies market acceptance of that new level.
Got that? That’s important.
That one single bar changed the odds from (guessing) 55/45 bears to 55/45 bulls. Not quite betting odds yet, but getting interesting.
Next we have some kind of a low volatility sideways range. Three weeks of boring crap. Markets do that, get fascinating for a few bars, then go back to being boring for a longer time
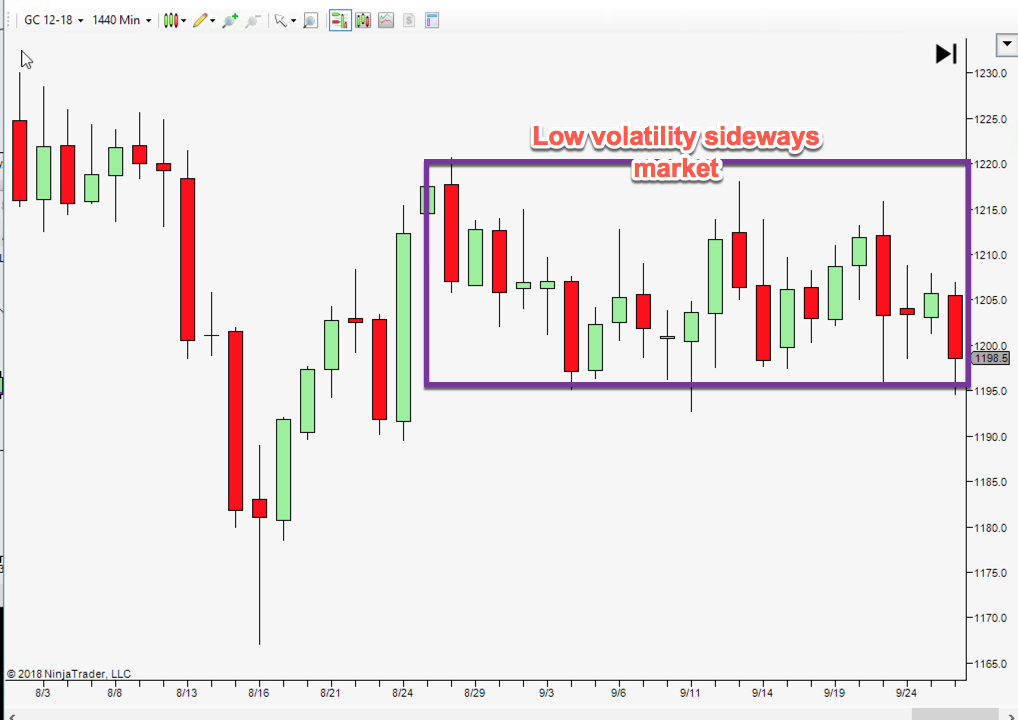
How do we know it’s a low volatility sideways market?
We COULD put an indicator like ATR on it, but in this case no need. It’s a choppy period with many overlapping bars, and not many stretches of the same bar in a row. And the swings between highs and lows are small.
What do we know about these markets? Think of this like a war of attrition. Eventually one side runs out of ammo and the other side takes over.
When you see the SMALLEST candle in a trading range you ought to pay attention, because probably that is a peak of market boredom which is unsustainable. Markets often break out the very next bar.
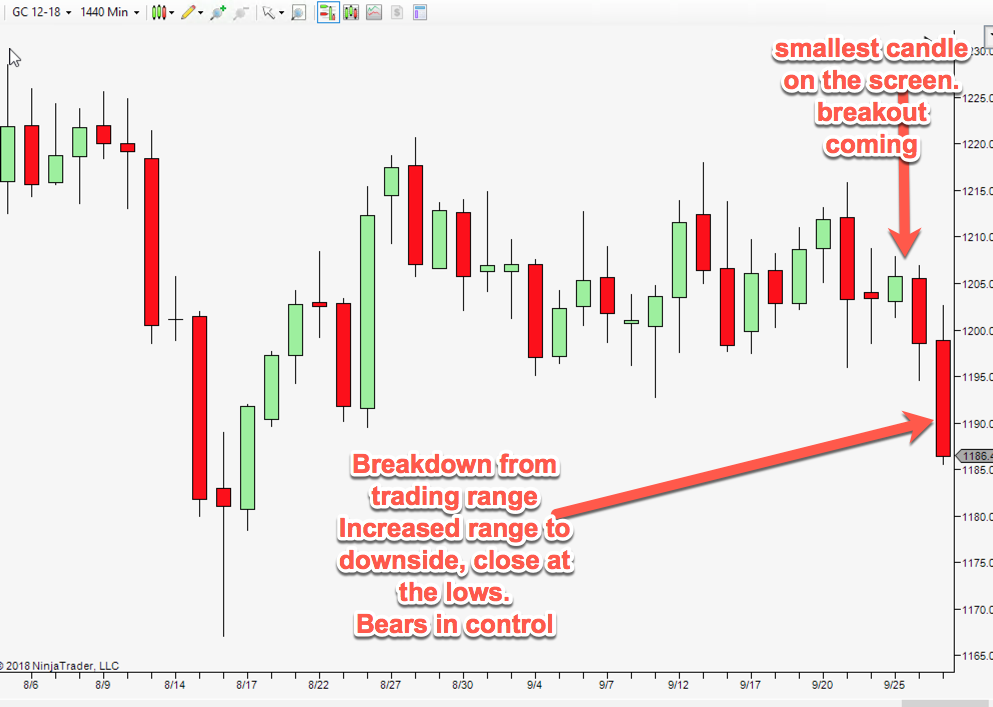
Advantage bears. They haven’t won yet but they are in firm control. At this point we should check how long the sideways bullshit has gone on.
A one month sideways period should mean an extended trending period after it chooses direction. But the bears haven’t won until they push it below the 8/16 lows.
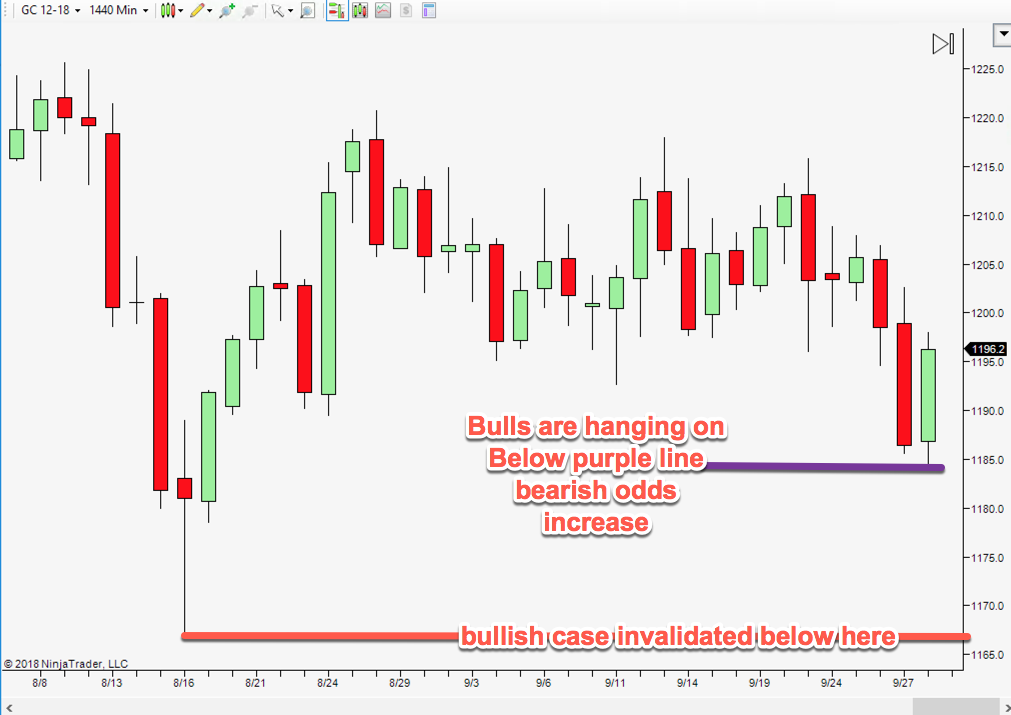
Let’s read the final (yesterdays bar)
The unsatisfying answer is that we just don’t know. The bulls are hanging on valiantly. It’s probably a coin flip until we either break below the red line above, or the bulls push it above the trading range highs.
The odds are probably 50/50 at this point.Sometimes markets are like that. The odds change all the time. When the odds change I change my mind. When the facts change I change my mind. What do you do?
I hope this neatly illustrates how much more detail you get by reading the Price Action instead of just drawing random lines over your chart.
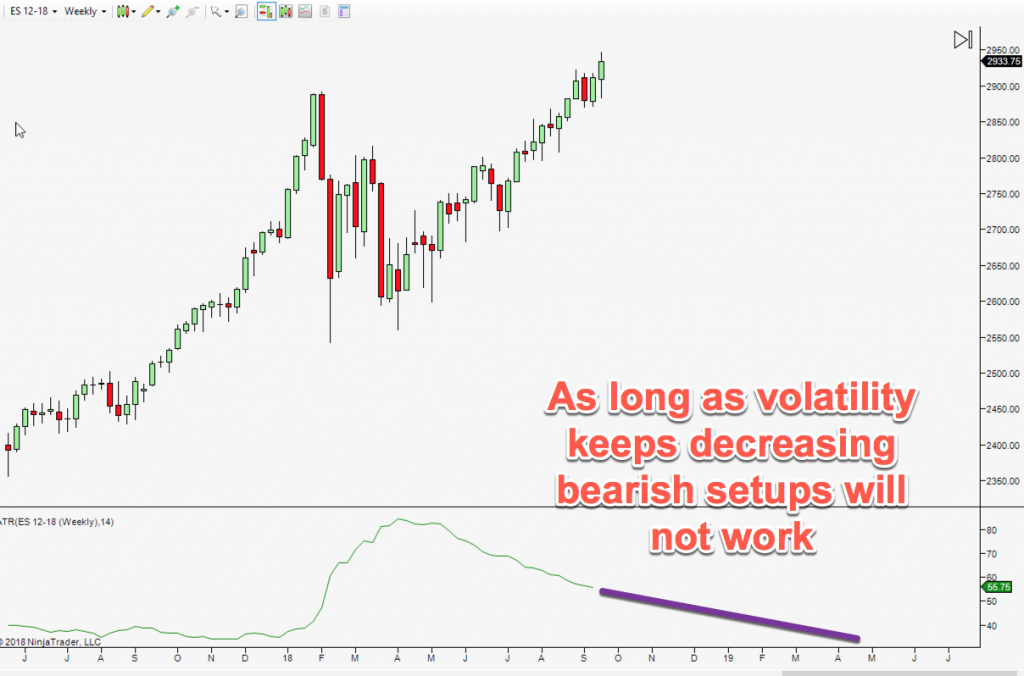
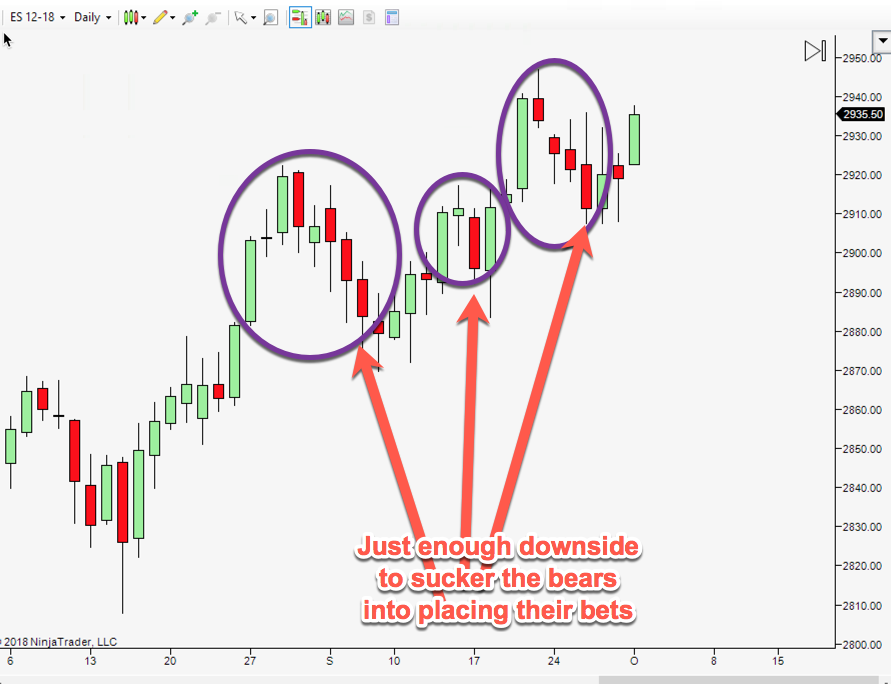
Since then despite all manner of news the market has just steadily ground higher.
The bears get just enough of a sniff to sucker them in… and then WHAM! Punched right in the face.
Just like we thought would happen.
| Whats my point? The point is that in the last 2 weeks on the S&P 500 futures we have two trades from the Thor System I’ll be demonstrating this Wednesday 7pm EST (October 3rd) |
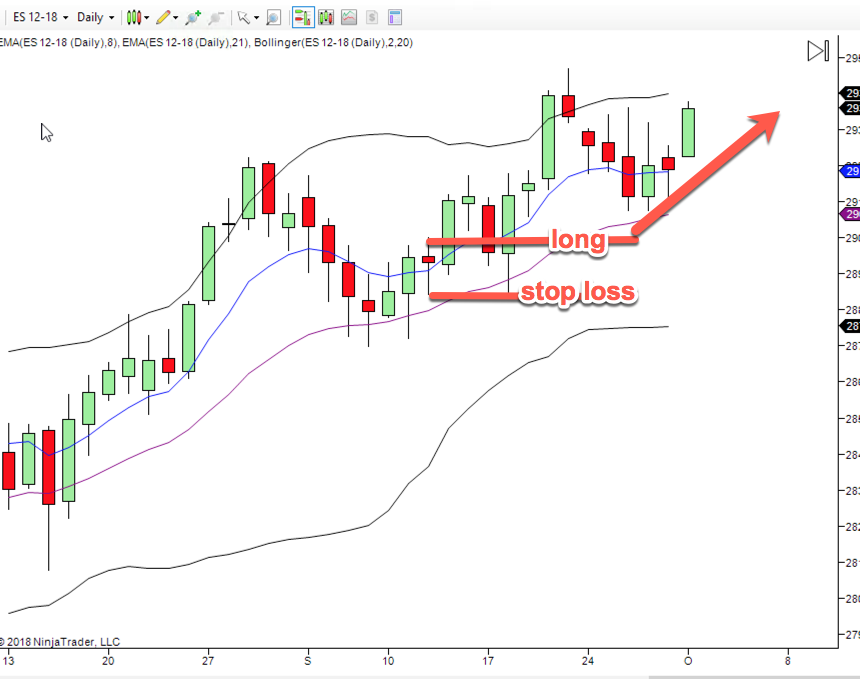
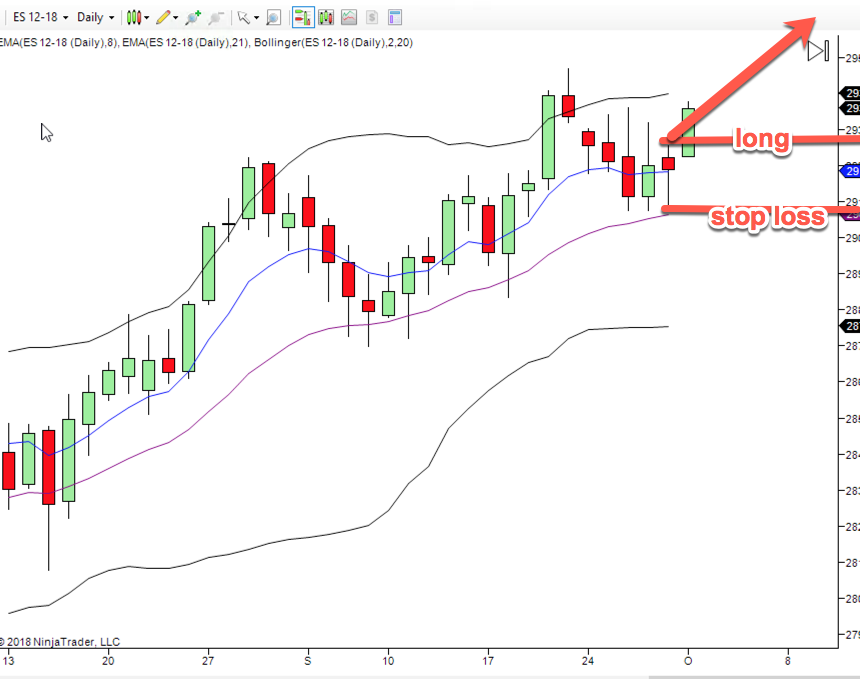
By taking these system trades I got EXACTLY the same result as if I was reading the tape and paying ever so close attention all day every day.
Except without all the stress. Without all the thinking.
Without all the skill to be brutally honest. My cat could have traded as well as I did.
That’s the thing about system trading. You put all your skills into building the system, and when it comes time to trade you just turn into an execution monkey.
It’s not glamorous or exciting, but it has it’s good points too.

Leave a Reply