Project: OPTIONS DASHBOARD
I am learning the art of reading the markets then synthesizing elements like price action, structure, levels, Un Filled Orders, ‘market internals’ and intermarket themes into a contextual view that I call “my Dashboard”. And organize this information in a trading journal. My trades are less about emotions and more about market action. For me, mindset is the most important aspect of trading, the way I think when trading (I am still developing the mental habits (mindset), with following goals:
Discipline: I am the CEO of my brain, and trading is my business! I will be a disciplined trader, each and every single trade. Everything I do is for the success of my trading business.
Original trade: I will trade my own trading ‘setups’ originating from my own trading plans and strategies, I will not trade be copycat trader, copying mindlessly other traders’ plan. (TBD links to 8 step trading plan). Yes, other ideas can influence me, if I like them, I will study them, make rule-based decisions, and plan it to suit my trading goals.
Losses and risks: Because trading is my business, and losses are the cost of doing business. Therefore, small calculated occasional losses are OK with me. My trading style is more wins than losses in the long run. I only trade high reward setups with higher probability.
Gradual scale up: I started trading small lot size setups within 2.5% of my available account capital. I will earn the right to trade bigger, as my experience and account grow.

Building portfolio: I am bricklayer (trader) building my castle (portfolio) brick by brick, repeating same type of trades over and over again. I don’t trade to experiment, just to see what happens.
Pulling the trigger: When analyzing the trade candidates from my selection of markets, I finalize trades with scores. Once I find a setup, I do not hesitate; and once in a trade, I do not over analyze.
Trading Log: I keep a detailed trading log, and journal important notes and take actions after doing periodic trading journal analysis. One of the sub goals, for example, is to find where I stand in the ‘pyramid’:
Self-awareness level as a trader
- Unconsciously Incompetent: Johari’s window, a self-awareness tool, calls this level of aware lessness; unknown unknown. When I started trading ten years back, I had no idea why to trade, how to trade, what to trade, when to trade and most importantly above all how to trade! When, as a new trader, you are a green horn, this is your starting point. Ignorant of markets, strategies, trading psychology, plan, strategies, rules and objectives. You start your trading journey from ‘ darkness of ignorance’ and take the next step to ‘the light of conscious competence’.
- Consciously Incompetent: When I know what I don’t know! Probably all traders start from scratch ‘unconscious incompetence’ (level 1above) meaning; still uneducated, but with a key difference, “as a trader I am now in a position to see my shortcomings on my way to being a professional trader. Apparently, my first three steps are going to be ‘learning’, ‘education’ and ‘training’. This is where I am hoping to be consciously aware of skill sets that I require in next level.
- Consciously Competent: This is what I am looking for, “What kind of traders I want to become? I have done my personal SWOT analysis in level 2, what education, theories, strategic plans and rule-based strategies do I need to execute my own trades.
- Unconscious Competence: Very few elite traders themselves do not know that that are Avant-garde. A rarely seen characteristics, where all rules, mechanics, math and strategies work flow is executed or performed without conscious. I can say with confidence that I am not an elite trader.
It might be a daunting task to keep track of every single trade we make, but keeping a trading journal requires discipline that in turn helps us to be a better trader in the long term. There are so many different versions out there, and everyone has their own preferences when journalizing. I want to know if anyone has created something that addressed different trading journal scenarios? I studied many online paid and free Trade Journal apps and services. Some trading journals are available for analyzing stocks, options, futures, forex, and cryptocurrency trades:
- TraderSync – Overall trading journal
- Tradervue – for professional traders
- Trademetria – simple design and included quote data
- Chartlog – Easy to use tools
- TastyTracker – I created a free account on Tasty Tracker to test drive
- Tradesviz -Many bells and whistles, I created a free account to test drive.
- Option Tracker Spreadsheet– Scott at his investing blog Two Investing has this free detailed Journal app. This is the most informative blog I could find to scope out and download to toy with different ideas.
- Build my own Journal– Best for us OTA traders! This is what we are doing.
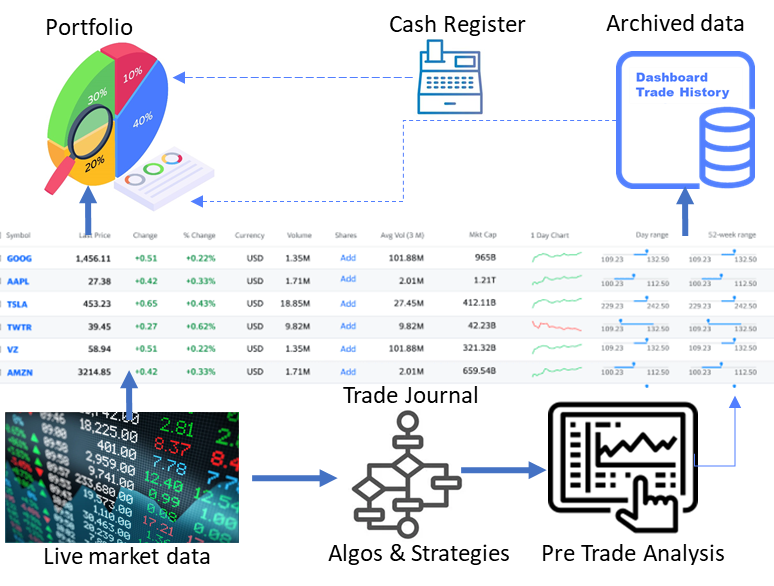
Workflow and logic for Dashboard
Setting Goals
First thing first, the objective that comes to my mind when talking about why to use a trade journal. What goals, progress monitoring, timeframe, and what is required to accomplish our goals.
Mathematical Logic Behind Setup
Multiple setups we deploy when viewed analytically after a few months of data in a trading journal can determine the viability of a particular system, on a mathematical level.
Work on Weaknesses with strengths
When looking for new strategies you will find that trading systems can sometimes be quite tricky, even when it comes to easy strategies. As such, there is a possibility that you did not understand the system properly or you are not implementing it correctly.
Trading journal will help to review all of our trades with respect to trading system(s) we develop, update adopt and drop to see what went wrong and take proactive actions for our mistakes. When we review our trading journal again, we can compare the performance of the two periods.
Data Gathering with Trade Journal

While reviewing our trading journal, trades can be categorized into Markets, industry, asset type etc. to discover area can be the most profitable. We can break down the area in which we trade securities where we are most comfortable, knowledgeable and profitable.
Portfolio Management
 Our Trading journal has an integrated portfolio to factor in brokerage fees, commissions, P& L, ROC and all those bells and whistles to calculate accurate returns. Monitoring Potential Growth Stocks

Who Is Accountable to my trades?
Who will tell me, “Do not execute impulsive trades that are not a part of my trading plan?”
Only, I am accountable for all of my trades, not markets, not charts or economy, but ‘me’!
Risk Management
A trading journal helps me to position size based on capital and risk factor and keeps me calm as I know the maximum pain a trade can cause me! a.k.a. Psychology of trading. We know well that emotions encroach in our trading.
Building Blocks- Journaling a trade
Trade Analysis Phases:
- Pre-trade
- Plan what underline assets class you want to trade: Customize the trade analysis sheet to prepare for Forex, stock, futures and options trading.
- Chart analysis – Mark it up with your buy and sell points alongside any trendlines, support, resistance, etc. Then, mark this chart with the trade info and archive it.
- In-trade
- Trade your candidate: record your every trade in the ‘Trading Log’.
- Log the trade details – Ticker symbol, trade date, buy price $, total shares, sell price $, return $, return % (at a minimum). Other great data points to track include stop loss, risk, and commission spend.
- Post-trade
- Analyze trades: The Analysis sheet automatically displays all stats for review.
- Identify Strengths & Weaknesses: SWOT analysis on trade categories giving either a positive or a negative expectancy.
- My trade notes – In my journal my brief note, what I did right, wrong, and overall recap the trade in your own words.
- Reflect back on trade data, chart, notes – Reviewing the journal to identify potential good habits adhere to and kick out bad habits, tweaks-adjust-modify strategies rules, identify areas for improvement and focus on the next trade.
- Archive trades – Once reviewed the trade to performance feedback loop trading journal entries can be moved to historical data.
- Improve: With this knowledge we can trade confidently, plan, adjust risk amounts and progress naturally as a professional trader.
| Phase | Pre-trade | In-trade | Post-trade |
| Goals | Preparing for the trade | Placing and monitoring the trade | Review trade, once completed |
| Tasks include | Market Newsletters Screeners Stock Picking Services Various Media Sources | Account -position updates Real-time Quotes Real-time Charting Trade Platforms Tools | Buy/Sell trade Logging Notes Review Charts Review Mistakes Review Strategy Tweaking |
build strategies
Concepts for strategy building:

Let’s define a “strategy” as a combination of three decision rules:
- What to buy? asset class
- When to buy it? Entry time
- When to sell it? Exit time
Many strategies need human decision-makers applying human judgment. Whether by person or machine, all three decisions are:
- made under uncertainty,
- driven by random variables
Let’s start thinking about creating a most “Simplistic strategy outline”
Rule 1.0: When to buy: Early morning (market open)
Rule 1.0: When to Sell: sell at market close (in a generally rising market)
Brain storming (analysis)— How do I know if I am trading in in a generally rising market?
New Rule 1.1: When to Buy and Sell: Buy at close, sell the next morning in a generally declining market.
New Rule 1.2: When to Buy and Sell: Buy a stock when it drops more than a certain% in one day and sell it back when the stock regains half of its loss
New Rule 1.3: When to Buy and Sell: Buy a stock when it hits a 52-week high and sell (a) after a certain % (e.g., 25%) rise or 10% trailing stop
These are probably all losers, but how can we tell? To answer that we move to the next stage called building a model:
Building a Model
- Start with a plausible hypothesis
- This is the hardest step and requires the most investigation
- Having said that, let’s begin with a ‘heuristic'(some info not perfect but general): “In a generally bullish period, BUY at market open, SELL at market close.
- Decide what data to test it on:
- Should we test on individual stocks or an aggregate?
- If individual, should we sample from a specific pool (e.g. consumer electronics-iPhone) might behave differently from pharma stocks like J&J?
- How should we select from the pool?
- What time interval should we test on?
- generally rising?
- generally falling?
- based on indicators (like consumer confidence)?
- random?
- Get the data
- But how do we know that it’s right? This is a serious problem across different data sources.
- What’s the right test?
- My test is to calculate delta = (Closing index value – Opening index value); for every day in the time period and then calculate average delta per day.
- If the model appears right, then What replications are needed, and on what data, to check this further?
- Replications on falling markets?
- Replications on broader market (S&P is a 500-stock subset of 1 5,500 stock market)
- Replication across geographic segments (BRICS Stocks? UK stocks?)
- Do these add noise that should be chopped from our buying strategy?
- If the model proves itself wrong, then study the fine grain of the data for evolution to the next model
- But maybe we get a new hypothesis
- Can we strengthen the predictable-rise-during-the-day hypothesis?
- study the fine grain of the data
- decide whether the hypothesis is wrong or incomplete if incomplete: vary conditions as (potentially) appropriate
- If the underlying theory is a daily rise due to optimism, should we buy only when Consumer Confidence is up
- do we have historical data)?
- Should we focus on stocks recently upgraded by analysts?
- What else could enhance a general optimism, increasing its impact for a specific stock or industry or sector?
- What if we tried EVERY variable?
Guidelines for creating strategies for Journal:
- Foundation of Many Strategies
- Select a stock based on its inherent value
- Select a sell rule based on price momentum (do we think it’s going down? sell!)
- But how do we estimate inherent value?
- Or perceived value?
- Or momentum?
- Write clear rules for each strategy – Organize each strategy with clear rules that are consistent. Preset profit targets, objectives and position management rules.
- Use numerical identifiers for version control- Start your first strategy (seed strategy) with “1.0” and update each time you change rules. You can progress to “1.1, 1.2,1.3 for minor updates” or “2.0,3.0,4.0 for major updates”
- Review Results – Analyze the net return of each strategy. but do not forget to include mistakes, time committed, trade frequency and your overall emotions
Journal Entry Columns
Journal entry columns can be broken down into these border categories:
Identifiers, Entry, Exit, Results, Tracking codes, Notes
- ACCOUNT: Multiple trading accounts
- Portfolio can have multiple trading accounts, for example one RRSP (US IRA), an account for stock and options trading and another one for futures.
- In multiple trading account portfolio separate database created for each trading account. You cannot create a report which includes both accounts` trading performance. Possible flag: if trader trades same symbol in multiple brokerage accounts, will the positions get mixed up?
- Sub accounts have to have the same base currency as the primary account.
- TICKER: The ticker symbol for the stock underlying the option contract. Dashboard uses Google Finance call to look up the stock price so you must use the ticker symbol as recognized by Google Finance.
- STRATEGY
- Shows the options strategy candidates.
- Used for analysis which are your best performing trade types – Iron Condors, Credit Spreads, Poor Man’s covered Calls, Butterflies etc.
- ACTION: BUY (long), SELL (short) refers to how the option was first started. If you sell a put you are technically “STO-selling to open.” Think of the ‘action’ column as a credit or debit indicator.
- EXPIRY: Expiry is the date that the contract is scheduled to end. When I close a contract before expiry, I update the ‘Close Date’ column.
- STATUS: Open, Closed, or Exercised (Selling a covered call might result in getting called away)
- CONTRACT: UNITS stands for contracts to indicate how many contracts were sold or bought
- QTY: Most equity contracts are transacted in increments of 100 shares per contract but Future Options (FOPs) like MES (micro-Emini) are size 5 per contract
- LEGS: The strike price(s) of the option. (Right now, only 4 legs are available 6 legs TBD)
- -P
- +P
- -C
- +C
- WIDTH
- MARGIN: Y/N. Yes if, account type is regular t-account, IF (A2: A=”WORKS-78″,”Y”,”N”)
- ENTRY PRICE: Premium $ amount collected ‘credit’ for selling a put or call. ‘Debit’ $ amount is what I paid for a long put or call. Most contracts are transacted in increments of 100 shares per contract, so premium is multiplied with Lots (units of contract).
- Side note: TBD multiple entry prices, is stop price needed or add a ‘stop price’ and ‘target price’ as option entry in case we are executing orders from stock charts.
- FEE+ COMM: all fees and commissions associated with the initial (opening) trade and closing trade added together.
- CLOSE: date closing trade executed or it expired. Close date used to calculate the DIT Days Held, and calculate the annualized rate of return.
- EXIT PRICE: the premium to close the option position. If it expired, leave it blank or type in 0. If BTC (bought to close), then enter premium paid.
- PROCEEDS: net profit or loss based on class type:
- if (AT2:AT=”CASH”(Q2: Q*H2:H*I2: I),
- if (AT2:AT=”STOCK”, ((Q2: Q)*H2:H*I2:I)-R2:R,
- else if ((Q2: Q)-T2: T) *(H2:H*I2: I)-R2: R)
- ULA PRICE: Two prices for the underlying, (1) ULA Price -current price real time via google finance, and (2) ULA-DOC underlying stock price at the time of opening the contract. ULA-DOC is used to calculate the annualized ROR (rate of return) and calculation for determining margin cash reserve. =IFERROR(GoogleFinance(B2)
- B/E Start: This field shows the break-even price for the option exclusive of any fees.
- B/E End
- Risk Cap
- PUT $CASH RESERVE: the capital amount required on hand in order to sell the option. This will be 100 x the strike price. For a non-margin account, that total amount needs to be in the account before your broker will allow the trade to go through. This is why this is called a cash-secured put. That cash is escrowed/ear marked for that option trade in case it gets assigned put to you. If you sold a covered call, then this field is not used.
- PUT Margin: This reserve calculates the capital amount required in the account for a naked put sold in a margin account. Usually (IB-Interactive Brokers) calculations for Put Reserve are 25% of the underlying stock’s market value + the option ask price – any out-of-the money amount) x 100 (per contract) x the number of contracts. Needed information update here if other broker has different requirements for this formula.
- Exit %
- ROLL
- RESULT
- Roll Dt
- ROLL CR/DB
- Open/Roll
- Net Profit
- P/L
- R/R
- ROC : Return on Capital
- ANNUALIZED ROR: This calculates the annualized rate of return for the option trade.
- DD
- MM
- YY
- DIT: DIT (Days in Trade, since opening date), also other column DTE (Days to expiration) shows the days left on the option contract. Expired option contracts should display 0 (not a negative number).
- “Divide by Zero” error when closing a trade in the same day: nested If statements or the total days held = 1 =if(isblank(A21),,(if((T21=0),(if(AND(D21=”Put”,E21=”S”),(S21/M21)/365,if(AND(D21=”Call”,E21=”S”),(S21/(100*L21*J21))/365,(if(AND(D21=”Put”,E21=”S”),(S21/M21)/T21*365,if(AND(D21=”Call”,E21=”S”),((S21/(100*L21*J21))/T21*365), (S21/(K21*L21*100)/T21*365))))))))))
- W/L/O : win, lose or open
- P&L Per Day
- Capital: It is a good idea to track how much capital was tied up in the trade to calculate a return on investment for each trade.
- CLASS: asset class
- %ITM
- LOG
- Notes
TO BE ADDED TO DASHBOARD APP (Wishlist):
- CC COST BASIS: for selling covered calls. Also, to calculate the annualized ROR (rate of return column). However, this field is not currently used. The annualized rate of return is based solely on the option rate of return as calculated on the strike price. It does not take into account any gains or losses from selling the underlying stock. Any stock transactions are calculated on a separate sheet called Cash-Register.
- Earnings (or close by) date
- Previous quarter RV
- Previous 8 quarters average RV
- Enter below/above average RV
- Average post earnings move last 8 quarters
- SPY Price at time of entry
- Greeks: Some traders may want to include some data on the Greeks. This might be position delta, delta dollars, theta or Vega depending on the strategy. This is not something I include because I usually just monitor that for open trades in Interactive Brokers Risk Navigator. I also tend to create a detailed trading log for each major trade and track this via a Google doc, whereas the excel trading journal is more of an overall summary. I’ve included an example later in the article.
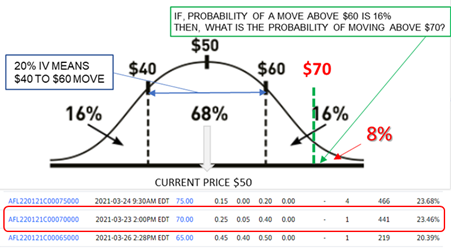
- Implied Volatility: Depending on the strategy, some traders may want to make a note of the implied volatility of the underlying stock or index at the time of trade initiation.
- IV Rank: Similar to the above, it might be helpful to know the IV rank at entry and exit of a trade.
- VIX at time of entry
- Chart time frame
- mistakes
- trade grade
- miscellaneous
Conditional Formatting Rules (JOURNAL)
- Column ACCOUNT: Range A1:A58, format cells if, Text contains your account-name as defined in CONFIG sheet column Y. Change your other accounts as well.
- Column ACTION: Color band based visual information codes showing how far or near the expiry date from today is? Custom formula for A: F background is:
- Red, if DTE less than 7=AND($F2<>”CLOSE”,$E2<(TODAY()+7),$E2<>””)
- Orange, if DTE less than 14
- light yellow, if DTE less than 21 days
- light green, if DTE less than 28 days
Journal Data entry
- Keep every trade with all legs together on a single row in the Trading log. When close out to exit trade, enter your summary exit price in column.
Leave a Reply